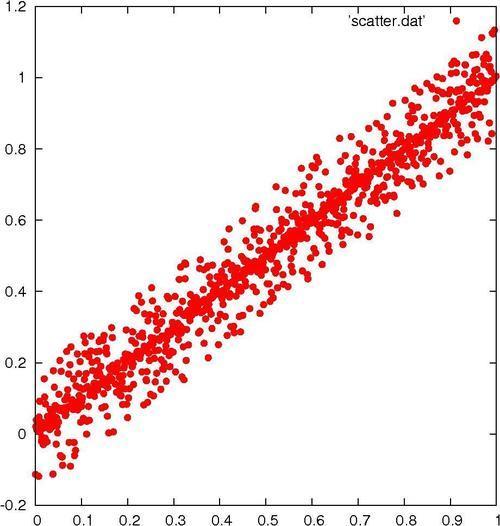
Making a scatterplot
If you are in possession of a collection of measurements that, as is usually the case, is subject to random errors, an attempt to simply plot a curve through the measurements may result in a chaotic graph that will be difficult to interpret. In these cases, one usually begins with a scatterplot, which is simply a plot of a dot or small symbol at each data point. An examination of such a plot often leads to the discovery of correlations or patterns.
Getting ready
To make this recipe interesting, we need some slightly random-looking data. You may have some available, in which case you merely need to ensure that it is in a format ...
Get gnuplot Cookbook now with the O’Reilly learning platform.
O’Reilly members experience books, live events, courses curated by job role, and more from O’Reilly and nearly 200 top publishers.

