Using two different y-axes
Sometimes our curves can or should not share the same y-axis. Gnuplot handles this with its tics commands, which we cover in greater detail in Chapter 4, Controlling your Tics. The following figure is a plot of two functions covering very different ranges; if the two curves were plotted against the same y-axis, one would be too small to see:
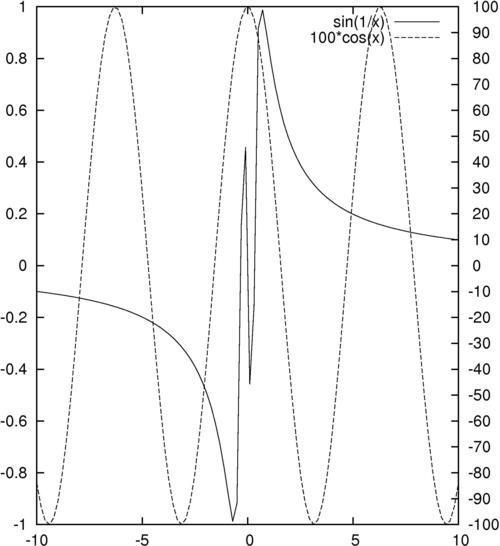
How to do it…
The following simple three-line script will create the previous figure:
set y2tics -100, 10
set ytics nomirror
plot sin(1/x) axis x1y1,100*cos(x) axis x1y2
Tip
You can download the example code files for all Packt books you have purchased from your account at http://www.packtpub.com ...
Get gnuplot Cookbook now with the O’Reilly learning platform.
O’Reilly members experience books, live events, courses curated by job role, and more from O’Reilly and nearly 200 top publishers.

