Time for action – making a surface plot
- First we define the domain:
octave:102> x = [-2:0.1:2]; y = x; - Then we generate the mesh grids:
octave:103> [X Y] = meshgrid(x,y); - We can now calculate the range of f for all combinations of x and y values in accordance with Equation (3.4):
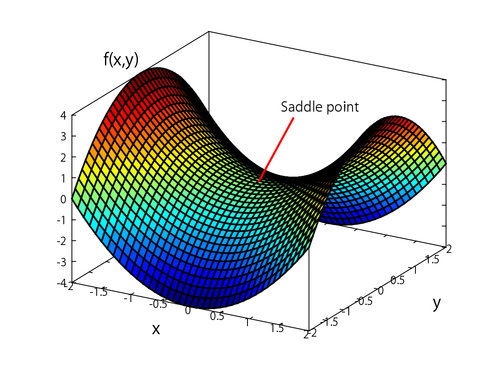
octave:104> Z = X.^2 – Y.^2; - To make a surface plot of the graph we use:
octave:105> surface(X,Y, Z)The result is shown below:
What just happened?
In Command 103, X is simply a matrix, where the rows are copies of x, and Y is a matrix where the columns are copies of the elements in y. From X and Y, we can then calculate the range as done in Command 104. We see that Z
Get GNU Octave now with the O’Reilly learning platform.
O’Reilly members experience books, live events, courses curated by job role, and more from O’Reilly and nearly 200 top publishers.

