A Line is represented with the ![]() icon.
icon.
The Line chart is useful for seeing trends and evolution. When you have multiple Lines, you can easily compare the values. However, it's harder to see the global trend than with Bar.
Here's an example of a visualization using a Line:
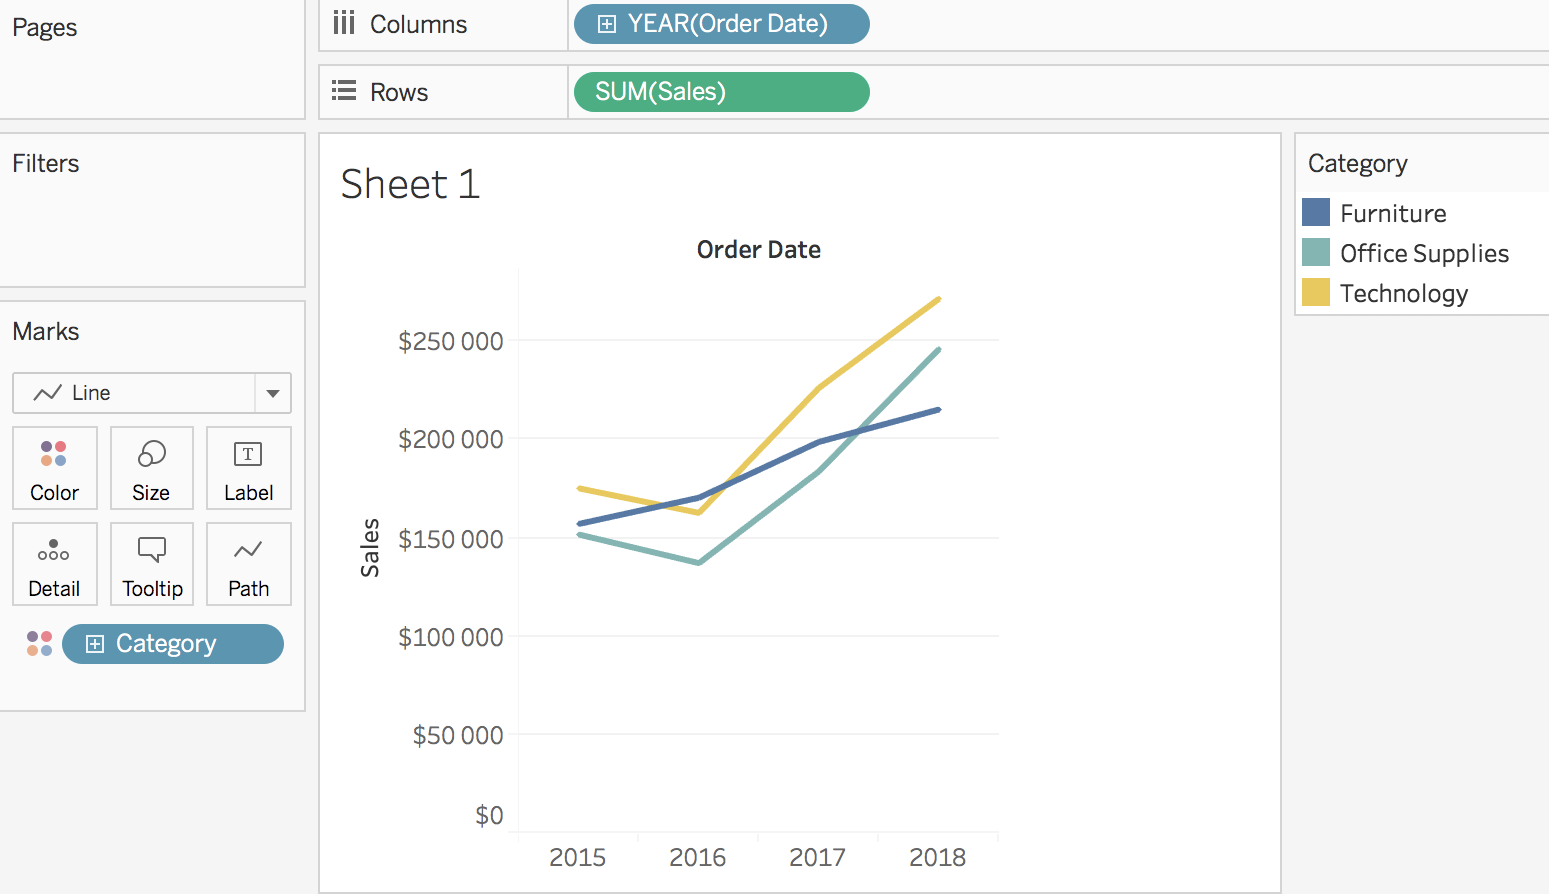
In the preceding screenshot, it's easy to see, in each year, which categories bring in the most sales. Also, Lines allow you to see the trend of each category. You can learn, for example, that in 2016, Furniture was the best category and now, in 2018, it's the worst.

