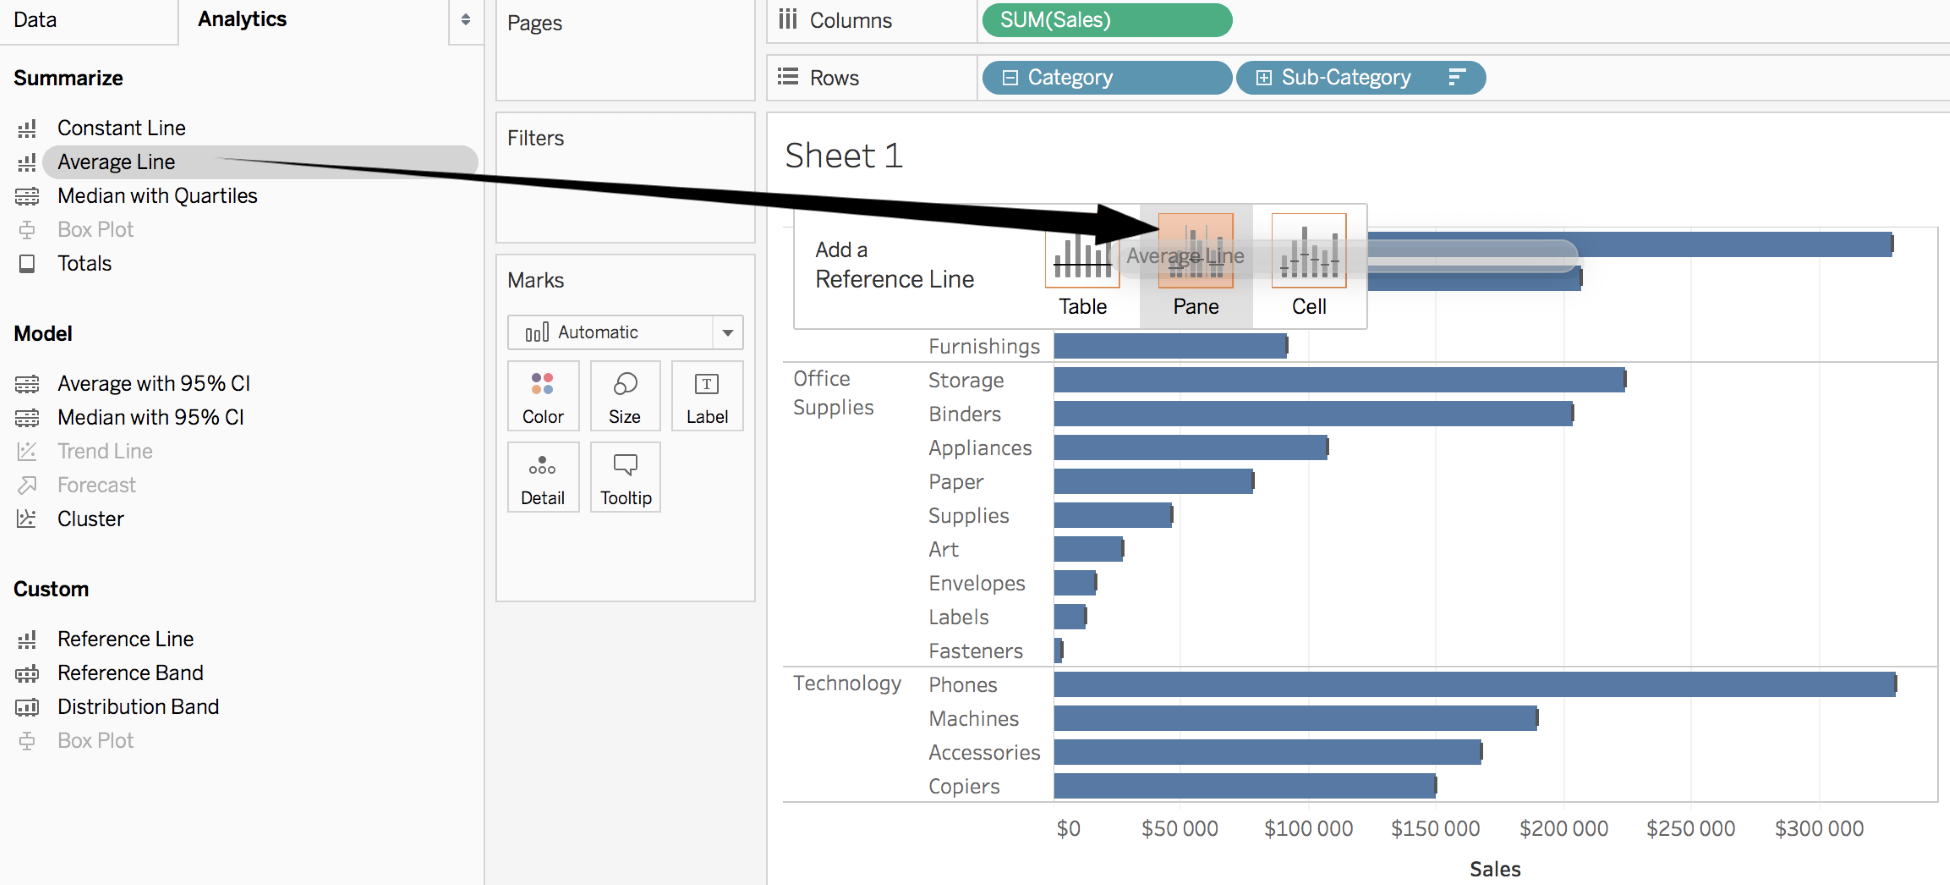
An Average Line works in the same way as a Constant Line. But unlike it, you don't enter any value. Instead, Tableau automatically calculates the average of the Measure. When you start to drag Average Line on the View, Tableau displays a menu where you can drop the option on Table, Pane, or Cell as shown in the following screenshot:
The icons help you understand the difference between the three options:
- Table: Tableau draws a unique line that is the average of all the Marks
- Pane: Tableau draws as many lines as there are intersections between the Dimensions (in the preceding example, three lines)
- Cell: Tableau draws a line for ...

