Before Tableau 2018.1, you could already build a Dual Axis map. To do so, duplicate the longitude in columns, or latitude in rows, and select Dual Axis in the pill option. Thanks to the Dual Axis option, it is possible to have two different Mark types and a different level of detail in each Marks layer. In the following screenshot, you can see a Dual Axis map, with a filled map for the state with the Sales in color in the first layer, and circles for each city, colored in black, in the second Marks layer:
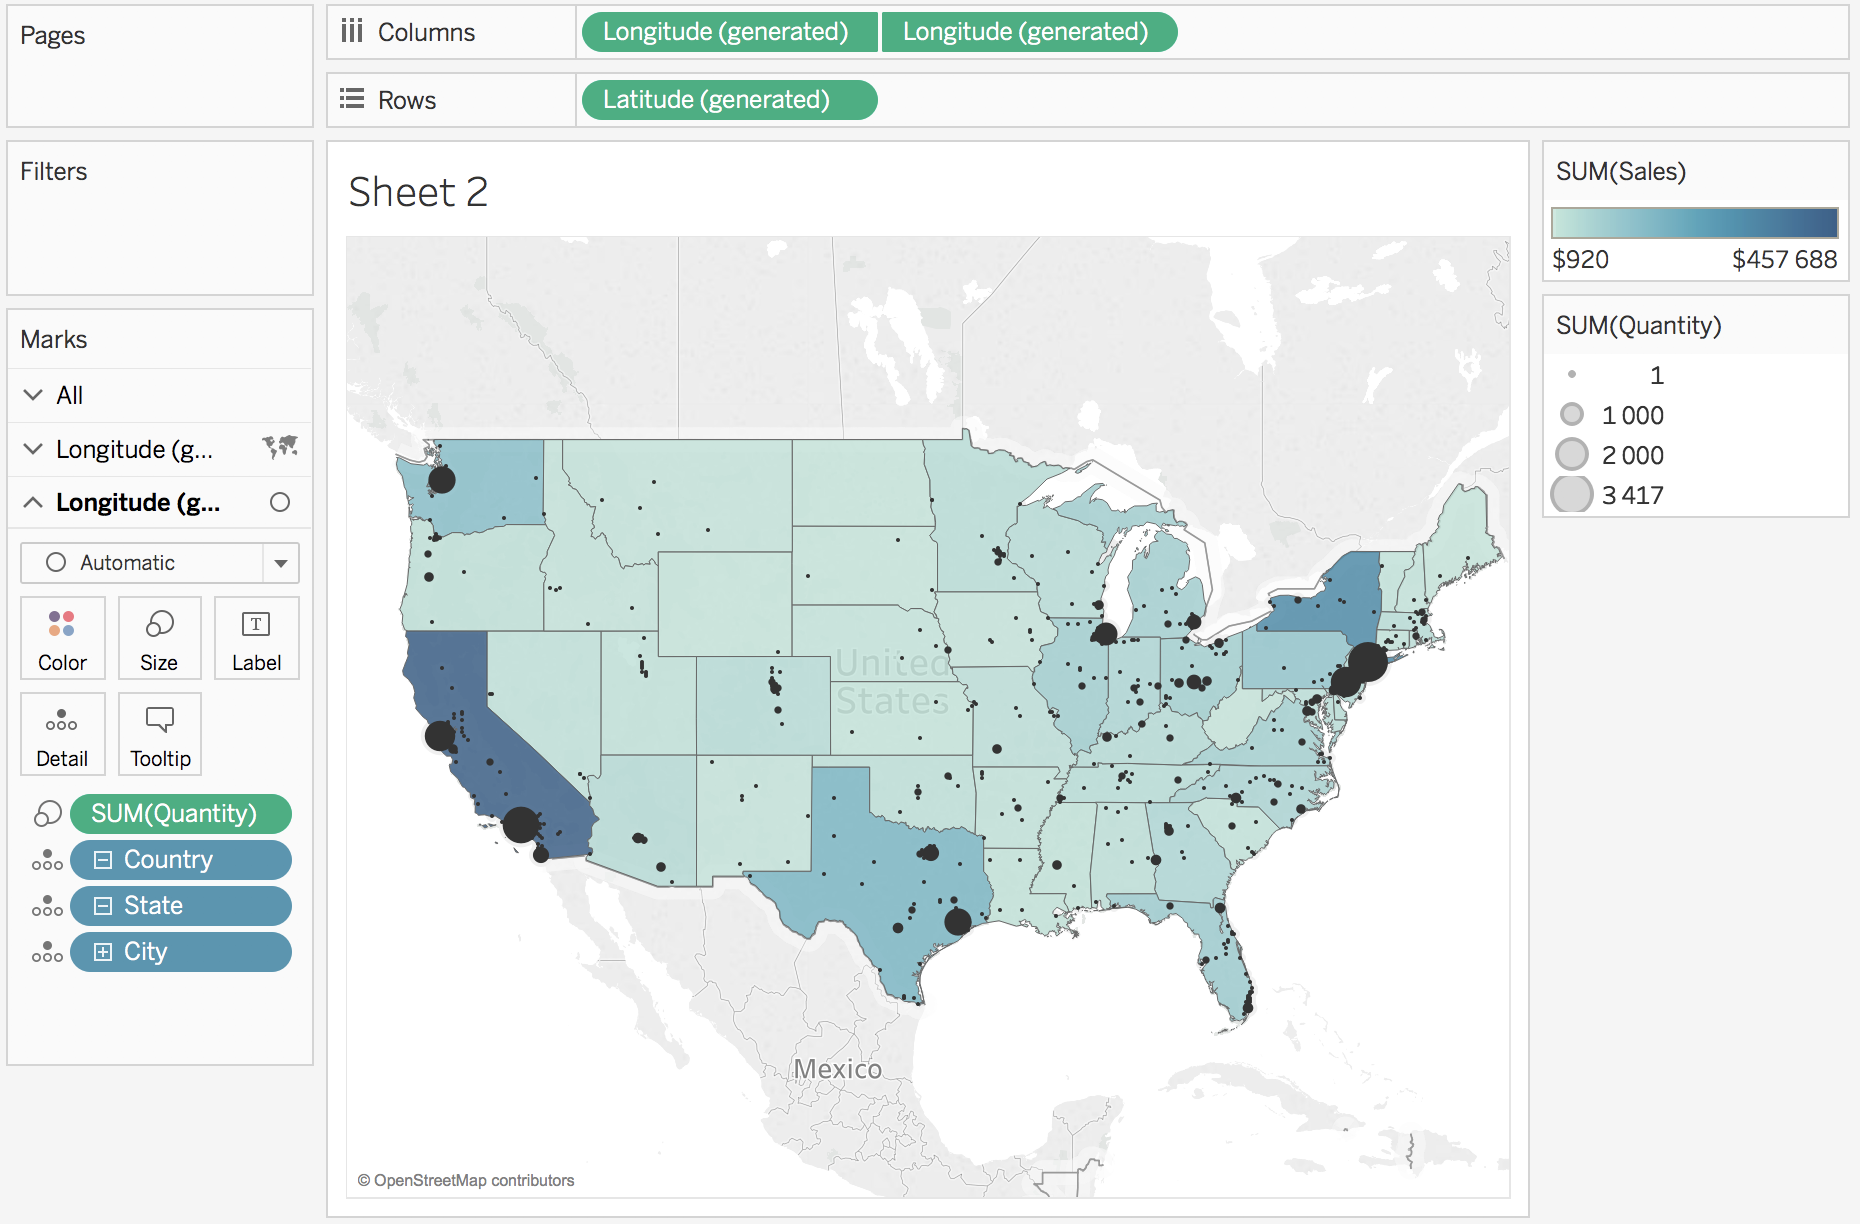
Unfortunately, in previous versions of Tableau, it was impossible to create a Dual Axis map by combining Tableau-generated coordinates ...

