You can only add a Trend Line when you have two continuous fields on opposing axes (one on Rows, one on Columns). The Trend Line can be used to see the trend of a Measure over time or the correlation between two Measures.
To add a Trend Line, drag and drop the option on the View. By default, the Trend Model used is Linear. You can specify the Trend Model to use when you drag and drop the option.
It's also possible to add a Trend Line with a right-click on the View, among the options available.
Here's an example of the usage of Trend Lines:
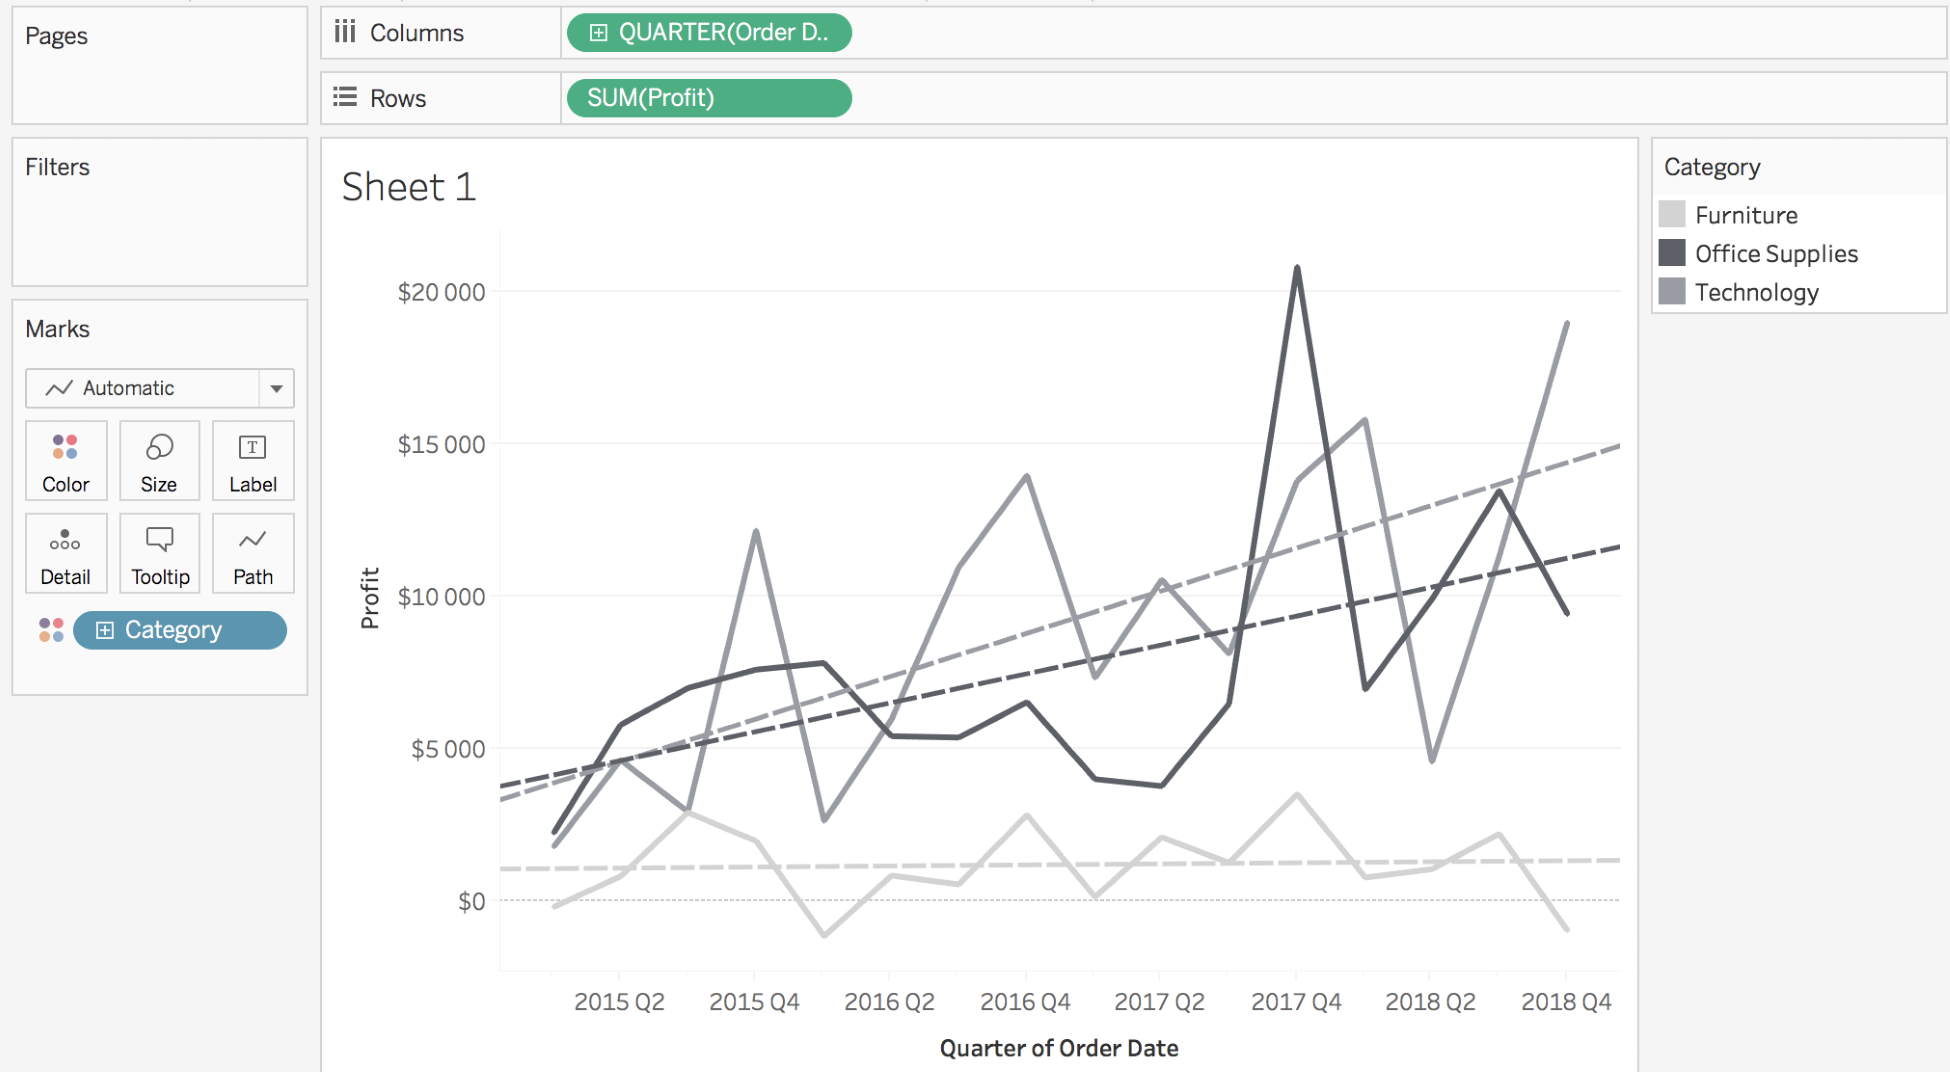
As you can see, it's easy to see that the profits are growing for Office Supplies and

