When creating a visualization on a worksheet, you always use the Data pane on the left, where you can find Dimensions and Measures. Under the aforementioned Data Source, you can see that there are two tabs: Data and Analytics. If you click on Analytics, Tableau opens a new pane, divided into three parts:
- Summarize
- Model
- Custom
This is highlighted in the following screenshot:
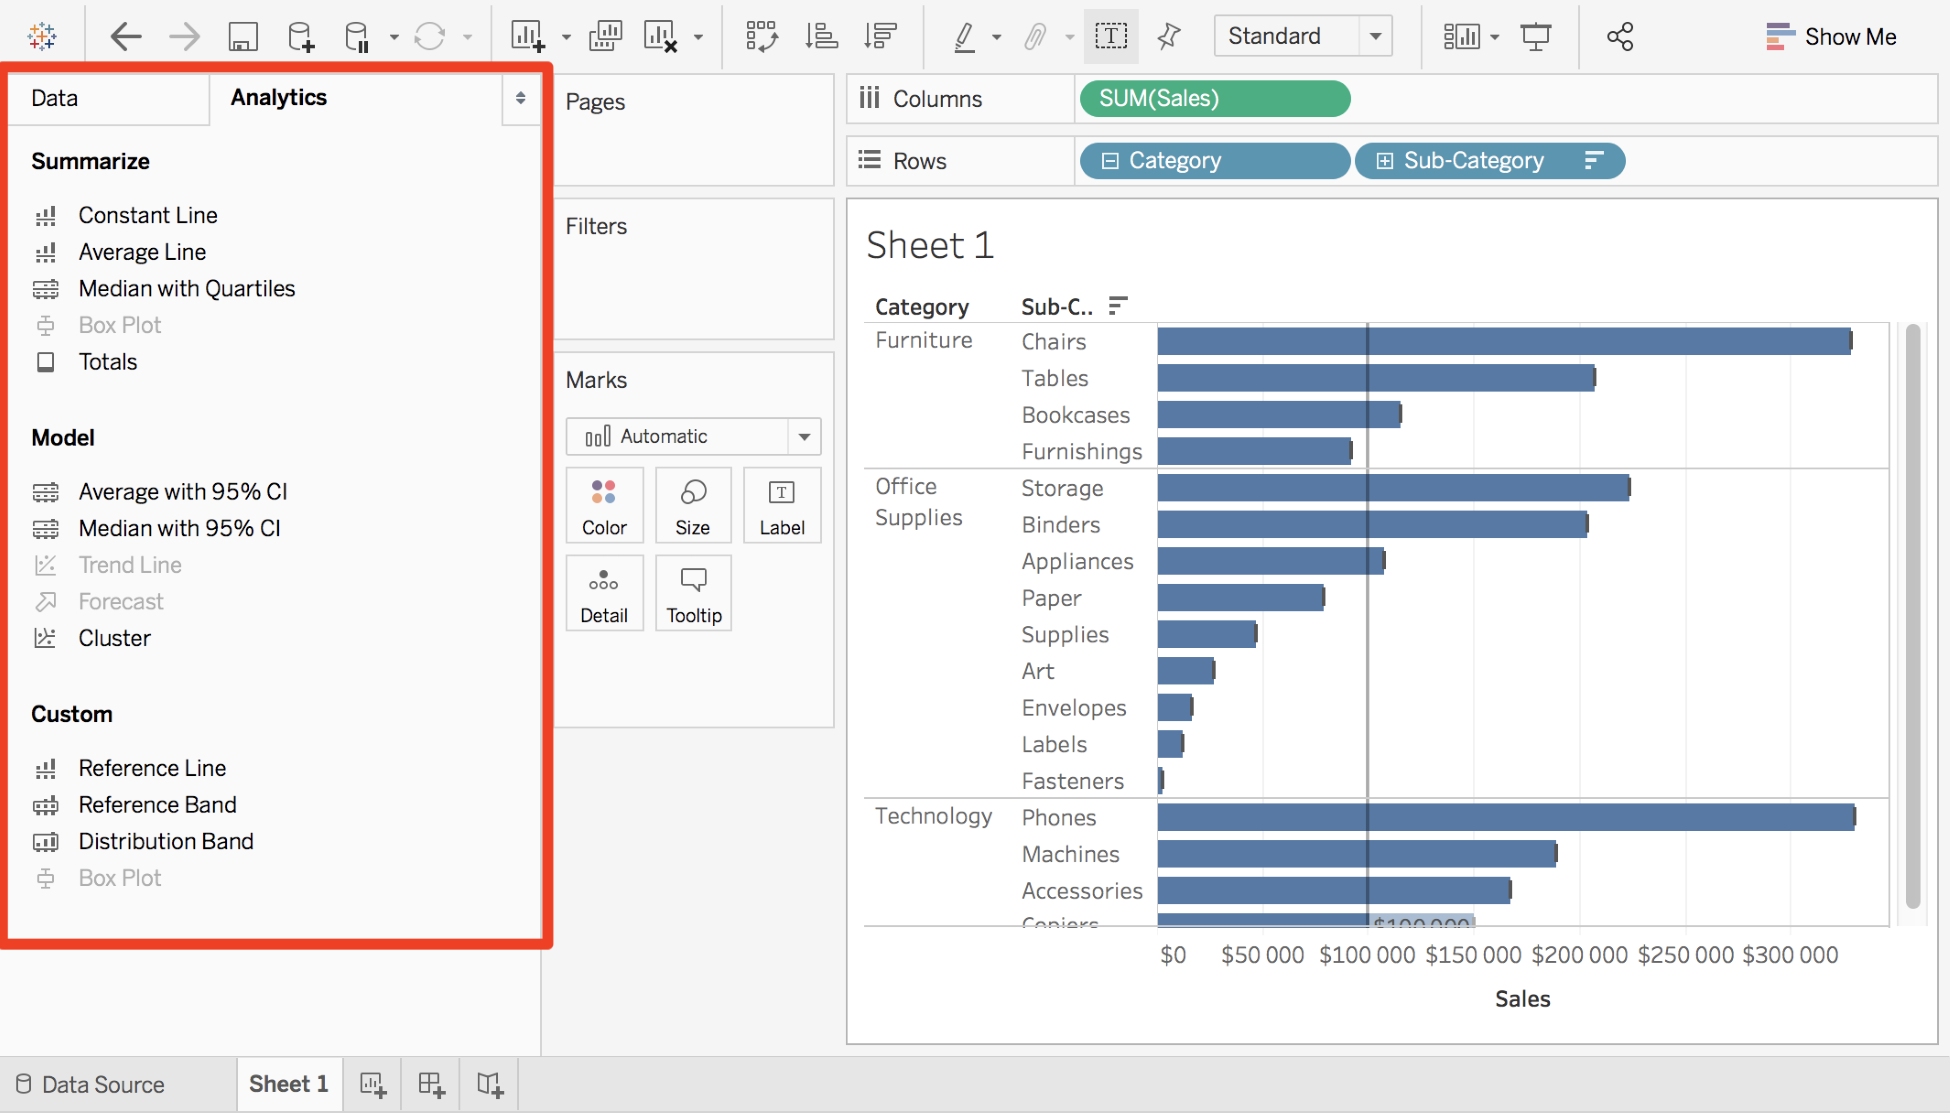
All the options on the Analytics pane can be found in other places in Tableau (with a right-click on an axis or the Analysis menu on top). The options in the Analytics pane are mostly just shortcuts or pre-configured options.
Let's explore ...

