Square is represented with the ![]() icon.
icon.
You can create two types of charts with Square: heatmap and treemap.
A heatmap is a table, but better. When you build a table, you have to read every value to compare them. Heatmap gives the same level of granularity (the same amount of information), but with the ability to quickly spot the top and bottom values. Here's an example of a heatmap:
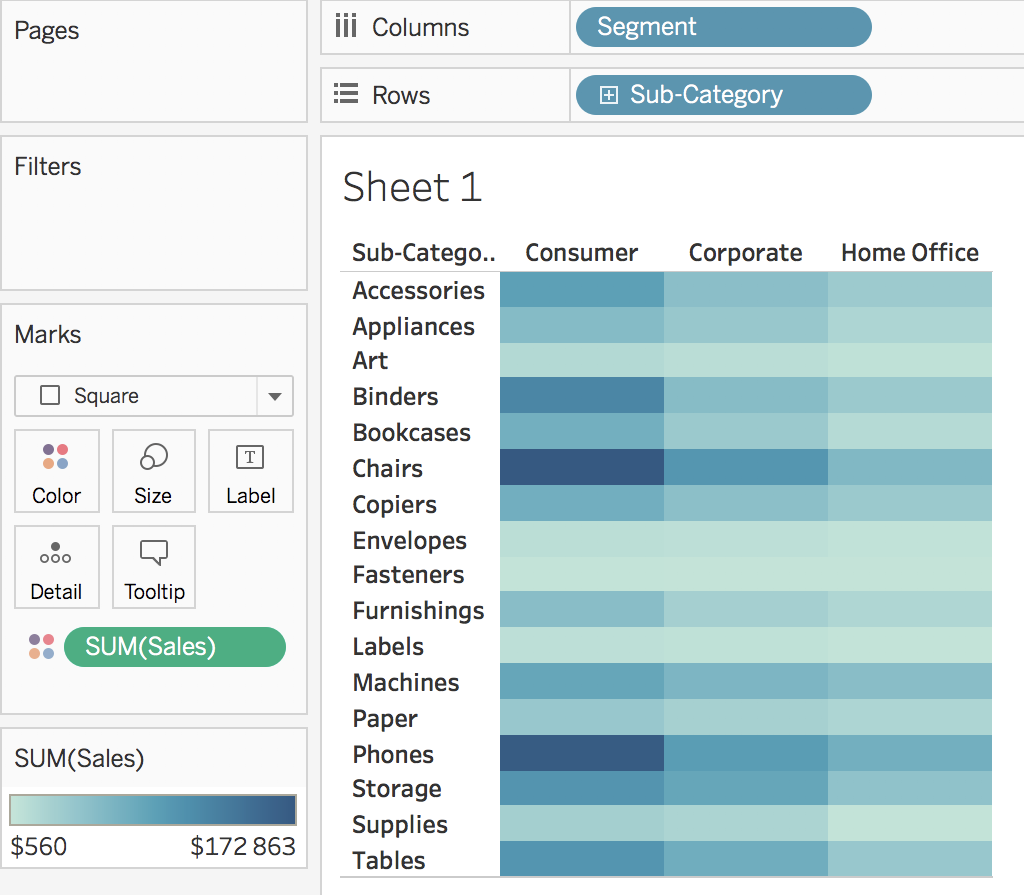
In the preceding screenshot, you can easily see that it's the Chairs and Phones of the Consumer segment that bring in the most money.
A treemap is a hierarchical ...

