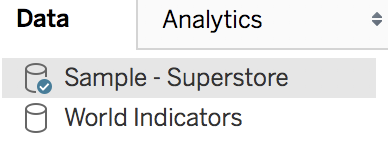
In a Workbook, you can add as many data sources as you want. In a Worksheet, you can see which Data Source is used thanks to the tick mark (✓) next to its icon, as you can see in the following screenshot:
You can create different Worksheets based on different data sources and assemble them in a Dashboard. But what if you need more than that? What if you want to create a visualization using two different data sources or create a unique data source based on a different type of connection? You can do all of that, too.
In this chapter about advanced data connections, we'll see how to work with multiple datasets as well ...

