The Box Plot option is only available when there is more than one unstacked Mark per cell. The Box Plot may be hard to read for people without any statistical background, but it's a great tool to see the dispersion in your data and spot the outliers. Here's an example of a Box Plot:
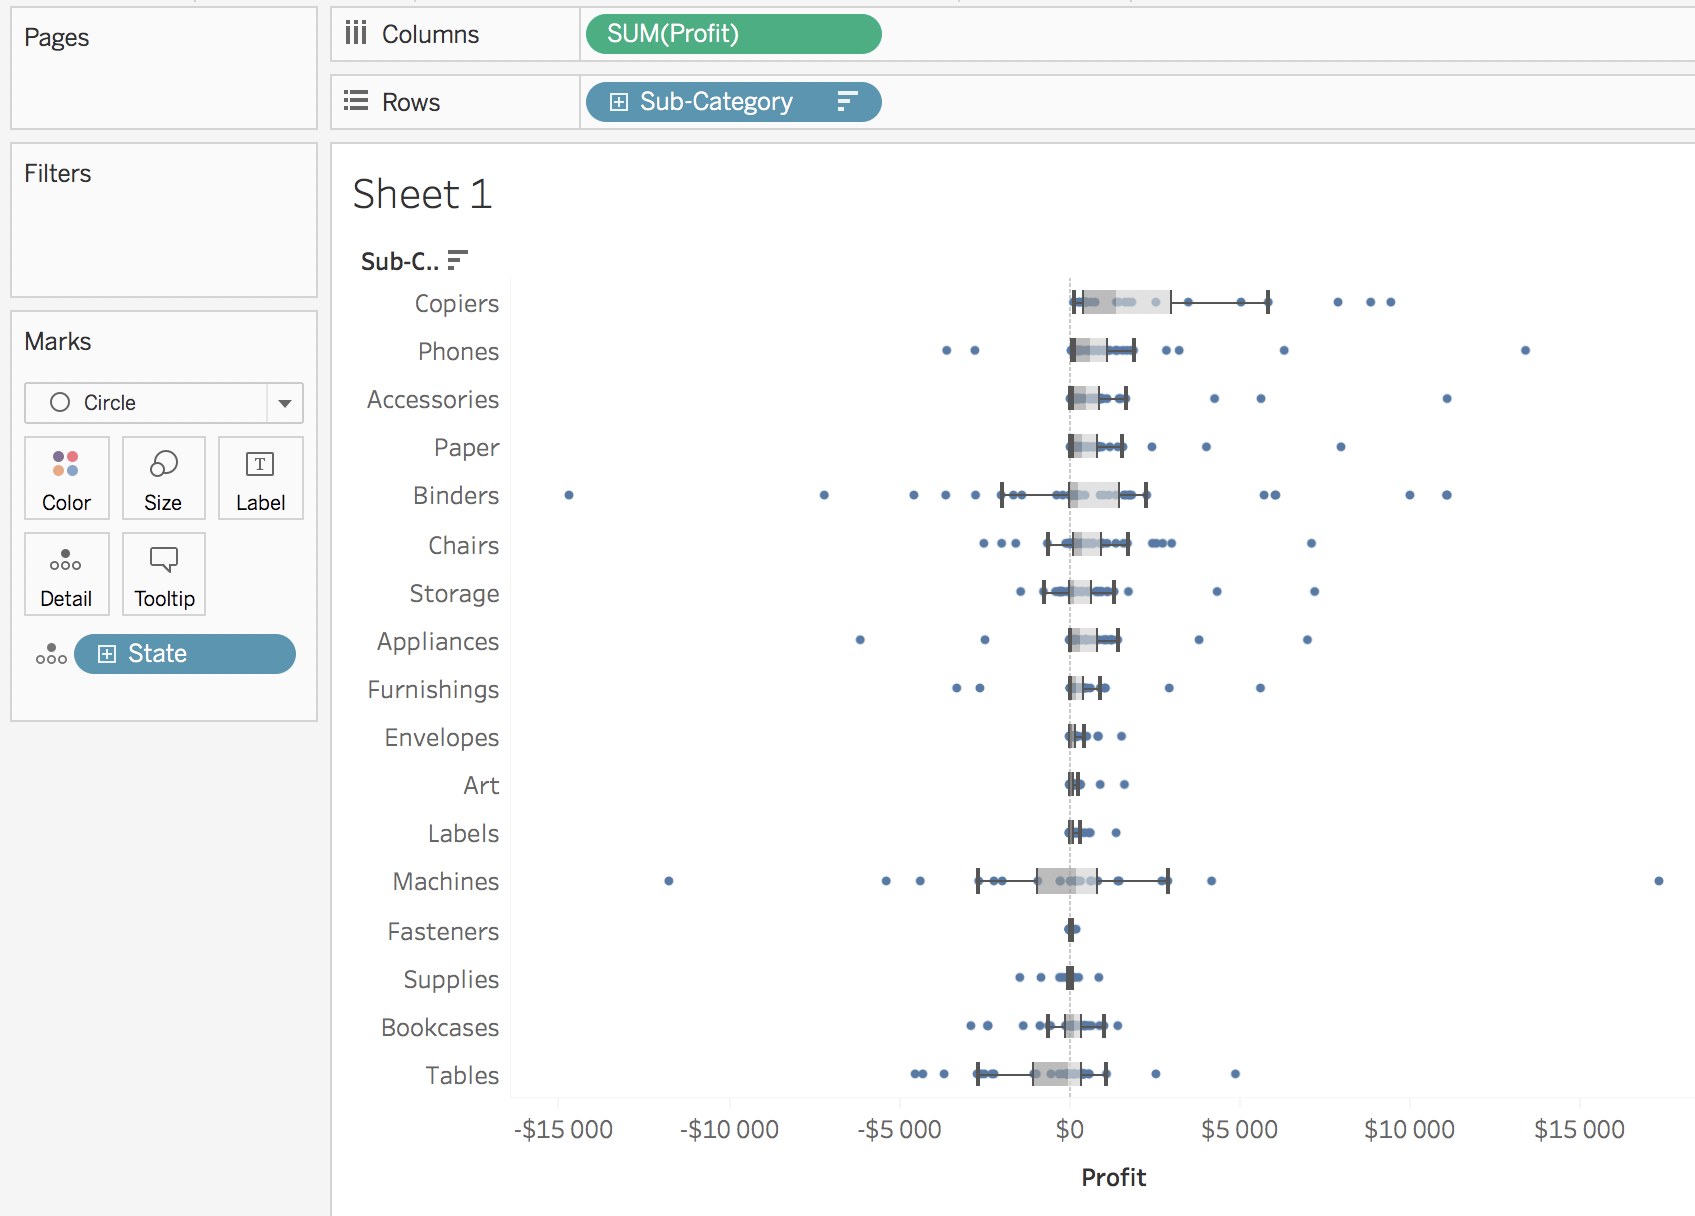
This example shows the profit made by each Sub-Category with one circle per State. As you can see, you can easily spot the outliers negative state in Binders or Machines.
The last Summarize option is a classic option called Totals.

