The first question we'll answer is: what are the product sub-categories that generate the most sales and profits? Let's find out how to do that:
- Double-click on Sales in the Data Source. You should now see one bar. If you put the mouse over the bar, you should read Sales: 2,297,201. As a measure is always aggregated, here you can see the sum of all the sales.
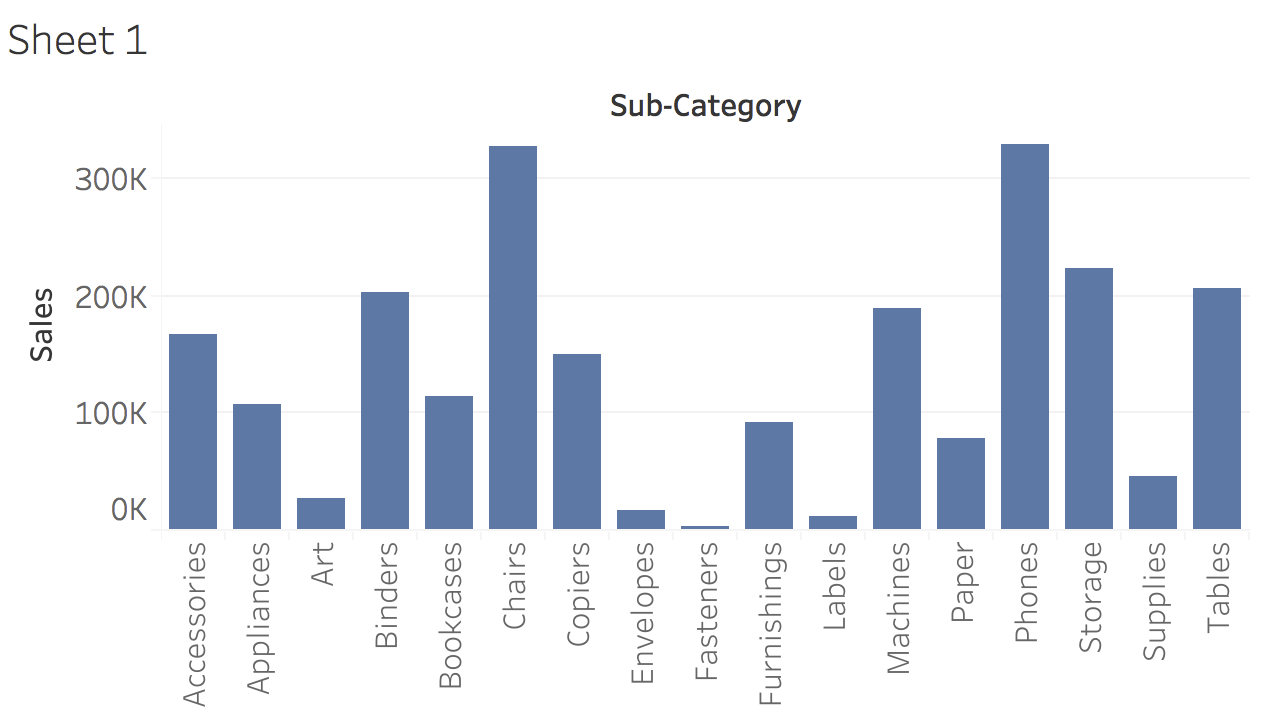
- On the Data Source, double-click on Sub-Category. The sub-categories now split the bar. A quick look can tell you that Chairs and Phones are the best-selling products:
- On the toolbar, click on the Swap icon: .This way it's easier to read ...

