Be careful; this is going to be quick:
- Click on the Profit by State Worksheet to select it (there is a gray outline once it's selected).
- Click on the funnel icon, the third one. It turns white once you've clicked on it. The icon is highlighted:
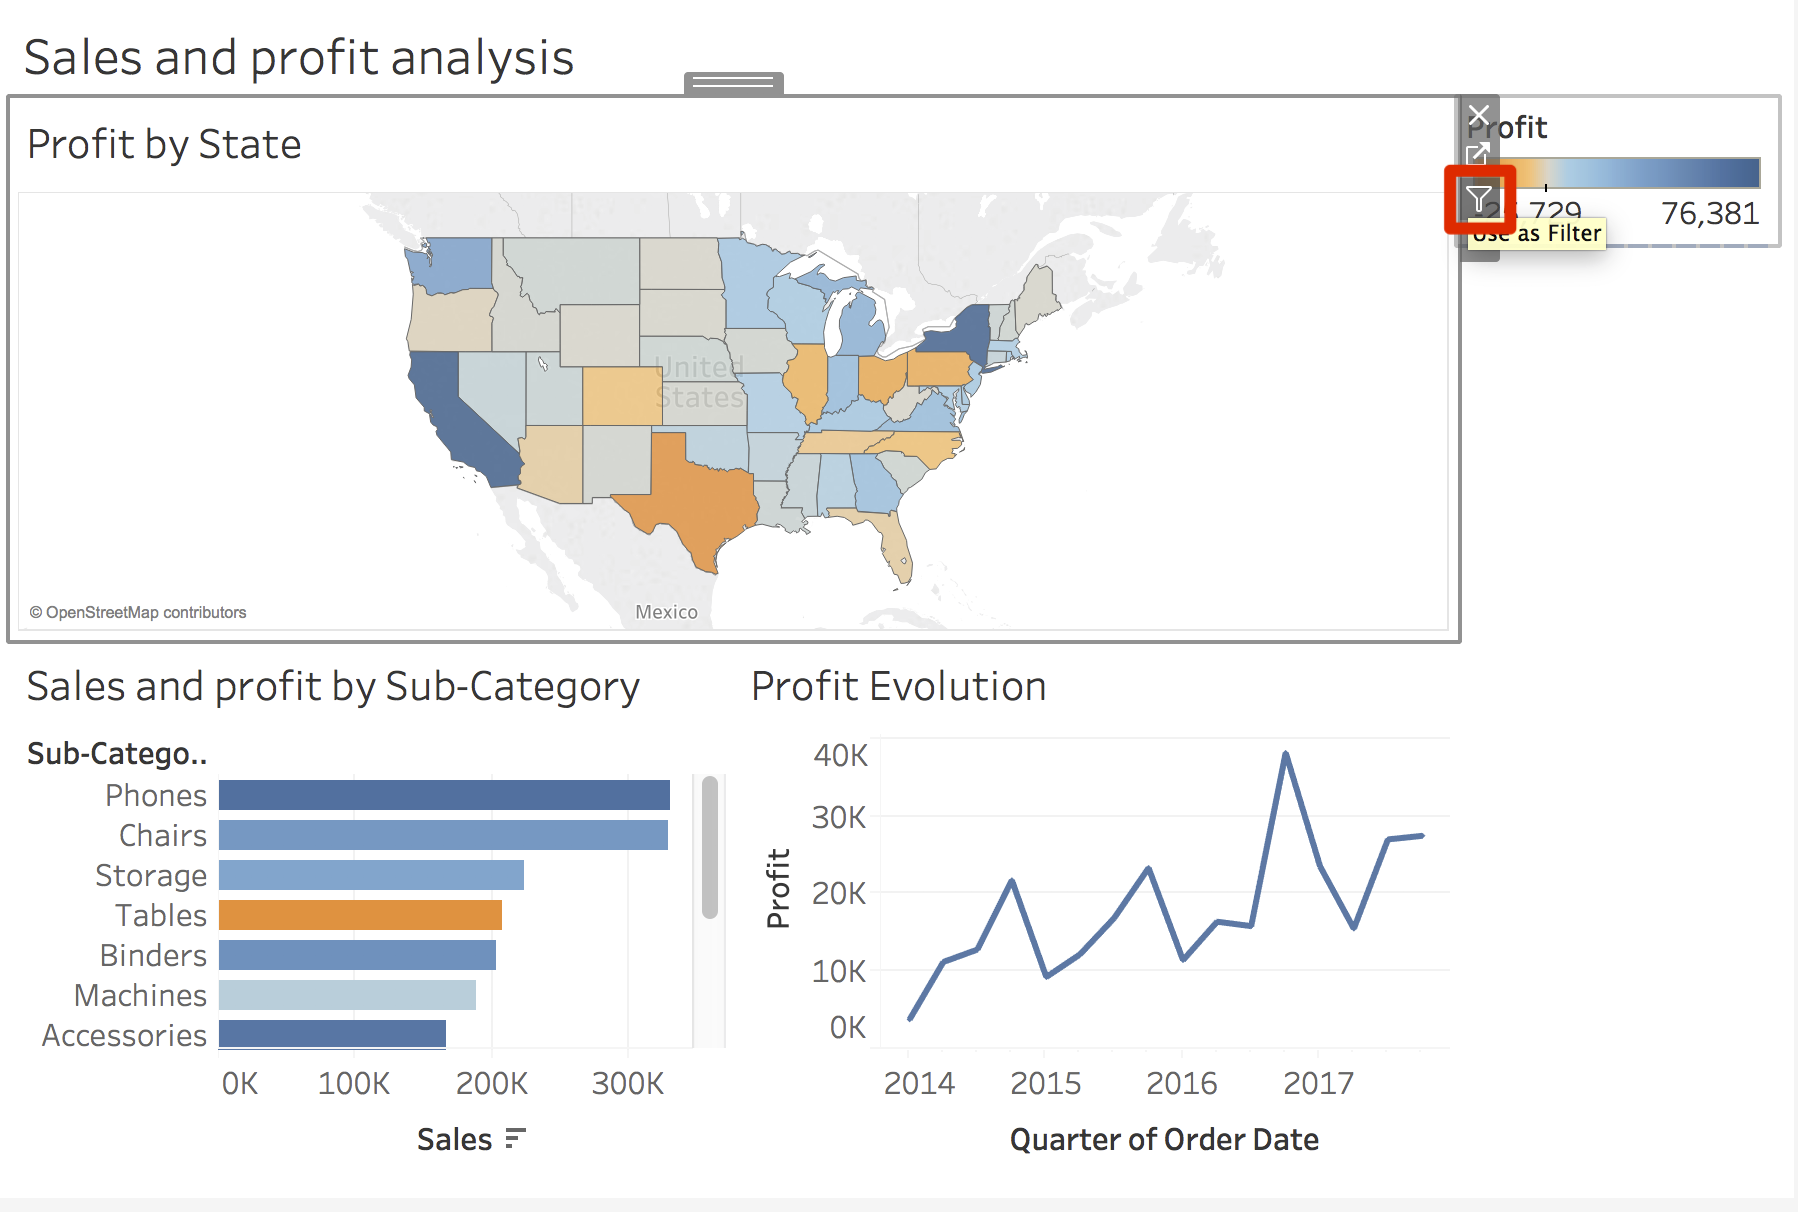
- Click on any state on the map and be proud! You just created an interactive Dashboard that automatically filters a selected state. You can also use Ctrl (Windows) or command (Mac) to select multiple states.
Why stop there? You can do the same with Sales and profit by Sub-Category. Just click on the visualization, then on the funnel icon, and voilà, you can ...

