Gantt Bar is represented with the ![]() icon.
icon.
A Gantt Bar uses a Continuous field (generally a Date) in Rows or Columns to set the initial position and another Continuous field in Size. The Gantt Bar is generally used to create a Gantt chart. This visualization is helpful when you manage projects over time or if you want to create a timeline, as in the following screenshot:
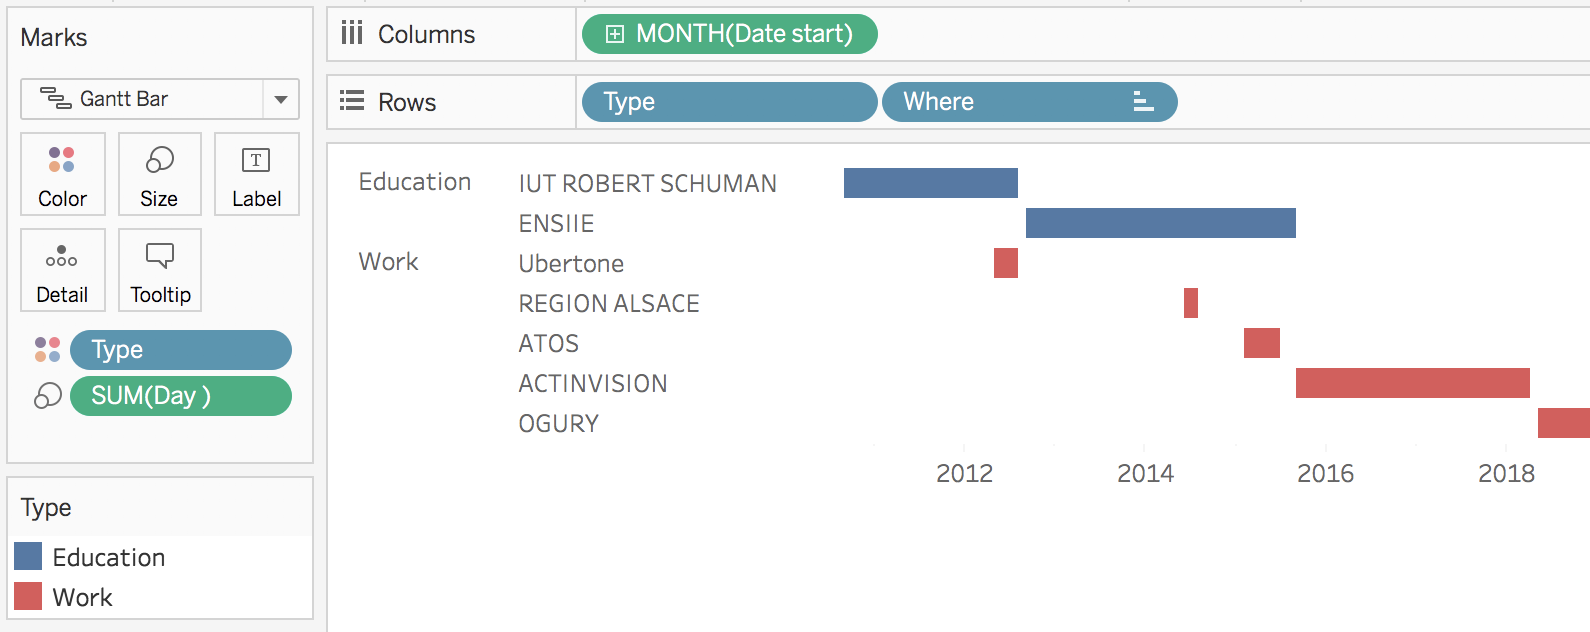
I built this Gantt chart for my resume. As you can see, there is a Continuous Date in columns and the number of days in Size. With this visualization, you can see when ...

