Chapter 11
Crunching the Numbers
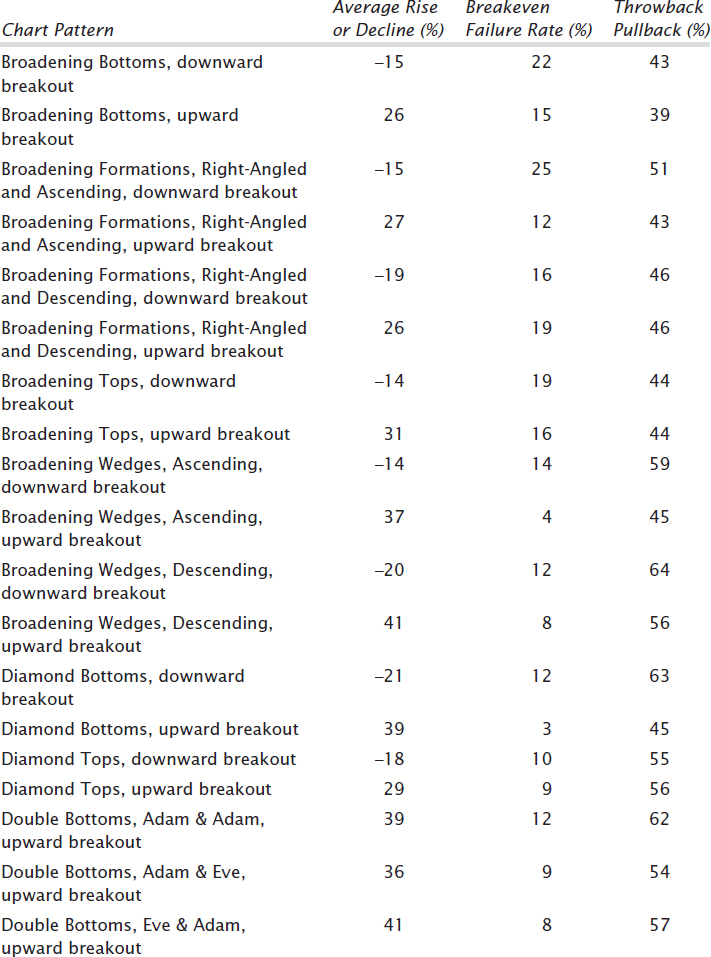
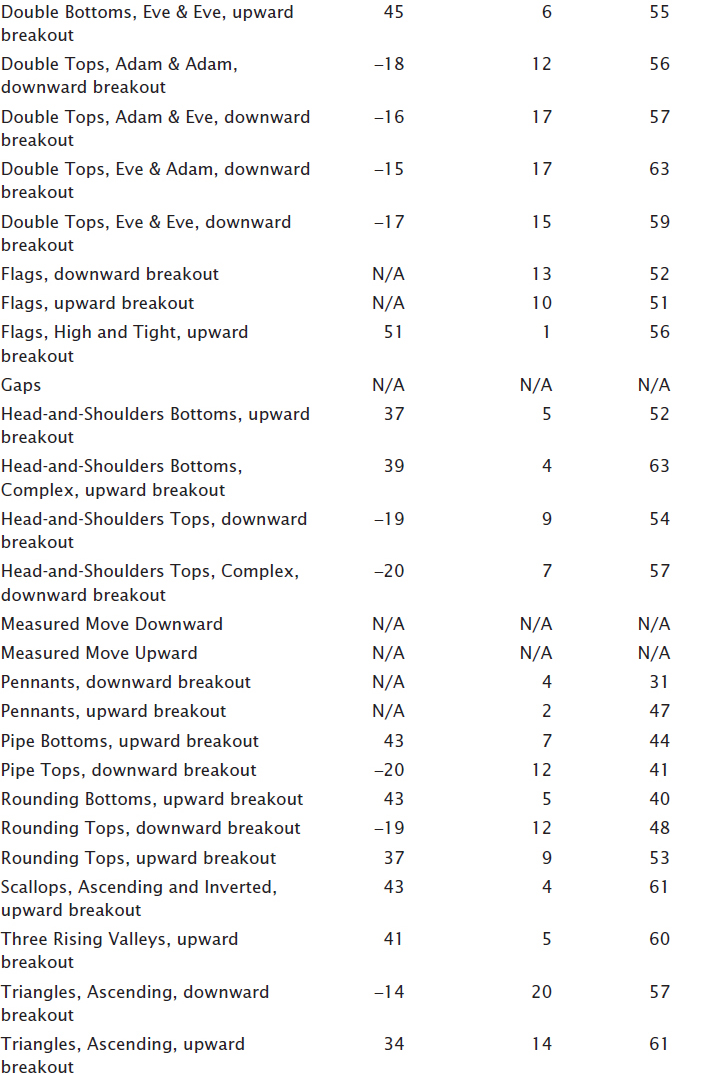
The statistics shown in Table 11.1 are from chart patterns in bull markets only. The numbers reflect hundreds and sometimes thousands of perfect trades without any trading costs deducted. Thus, don't expect your trading results to match them.
Not all chart patterns are shown. For a complete list of chart patterns in both bull and bear markets, consult my book, Encyclopedia of Chart Patterns, second edition. Some but not all of the chart patterns have been updated for performance. I removed the rankings since they are not available for all patterns at the time this book was updated.
Chart Pattern Performance: Notes
The following notes apply to the tables:
The average rise or decline is the percentage price move from the breakout to the ultimate high or low.
The breakeven failure rate is the number of patterns with prices that fail to rise or fall at least 5% after the breakout.
Throwbacks are for upward breakouts, and pullbacks are for downward breakouts.
N/A means not applicable. The performances of some chart patterns are measured differently from most others (measured moves, flags, pennants, gaps, and so on).
TABLE 11.1 Chart Pattern Performance
Get Getting Started in Chart Patterns, 2nd Edition now with the O’Reilly learning platform.
O’Reilly members experience books, live events, courses curated by job role, and more from O’Reilly and nearly 200 top publishers.

