Chapter 2
Identifying Chart Patterns
Learning to identify chart patterns is like learning how to recognize a ball. When someone hands you a ball, your mind forms rules to recognize it when you see it again. Even though the size, color, and texture may change, you can still recognize it as a ball. Then you'll discover what to do when your brother pelts you with a snowball.
In this book, we are going to use a similar approach by showing many examples of chart patterns. With practice, you'll learn to identify them, learn how to trade them, and dodge the dangerous ones.
The Blank Chart
Let's begin with a chart with nothing highlighted, shown in Figure 2.1.
This chart uses candlesticks to display price. Although I prefer candle charts, many of ones in this book are bar charts. I use bar charts so I can pack more information onto the small real estate afforded by this book.
When I look at this chart, my mind draws chart patterns by connecting peaks to peaks and valleys to valleys using curves and straight lines.
What can you tell from this chart?
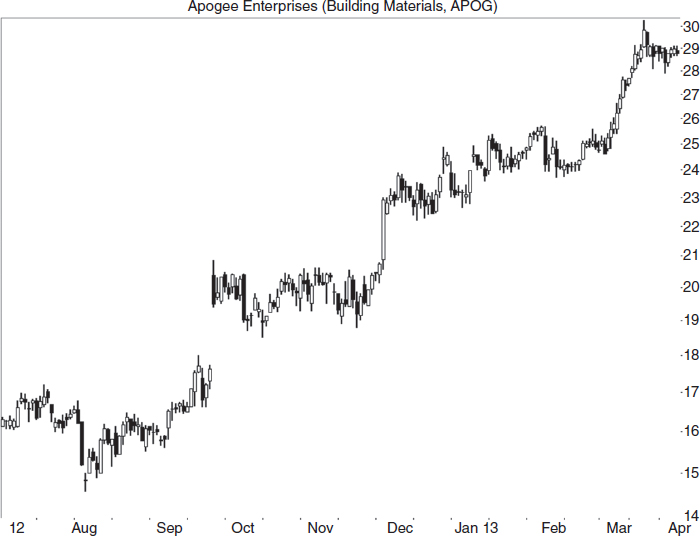
FIGURE 2.1 Even a blank chart shows valuable information.
![]() trendline
trendline
when price trends, a line connecting them is called a trendline.
Notice that price trends upward starting in August. If you were to draw a line under the major valleys, it ...
Get Getting Started in Chart Patterns, 2nd Edition now with the O’Reilly learning platform.
O’Reilly members experience books, live events, courses curated by job role, and more from O’Reilly and nearly 200 top publishers.

