Converting Arrow Diagrams to Bar Charts
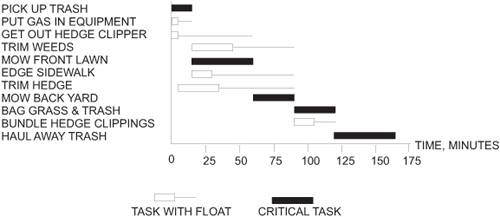
While an arrow diagram is essential to do a proper analysis of the relationships between the activities in a project, the best working tool is the bar chart. The people doing the work will find it much easier to see when they are supposed to start and finish their jobs if you give them a bar chart. The arrow diagram in Figure 7-3 has been portrayed as a bar chart in Figure 7-4, making use of what was learned about the schedule from the network analysis.
Figure 7-4. Bar chart schedule for yard project.

Note that the critical path in the bar chart is shown as solid black bars. Bars with float are drawn ...
Get Fundamentals of Project Management, Third Edition now with the O’Reilly learning platform.
O’Reilly members experience books, live events, courses curated by job role, and more from O’Reilly and nearly 200 top publishers.

