
i
i
i
i
i
i
i
i
2 7
2 7
Tamara Munzner
Visualization
A major application area of computer graphics is visualization, where computer-
generated images are used to help people understand both spatial and non-spatial
data. Visualization is used when the goal is to augment human capabilities in
situations where the problem is not sufficiently well defined for a computer to
handle algorithmically. If a totally automatic solution can completely replace hu-
man judgement, then visualization is not typically required. Visualization can be
used to generate new hypotheses when exploring a completely unfamiliar dataset,
to confirm existing hypotheses in a partially understood dataset, or to present in-
formation about a known dataset to another audience.
Visualization allows people to offload cognition to the perceptual system, us-
ing carefully designed images as a form of external memory. The human visual
system is a very high-bandwidth channel to the brain, with a significant amount
of processing occurring in parallel and at the pre-conscious level. We can thus
use external images as a substitute for keeping track of things inside our own
heads. For an example, let us consider the task of understanding the relationships
between a subset of the topics in the splendid book G
¨
odel, Escher, Bach: The
Eternal Golden Braid (Hofstadter, 1979); see Figure 27.1.
When we see the dataset as a text list, at the low level we must read words
and compare them to memories of previously read words. It is hard to keep track
of just these dozen topics using cognition and memory alone, let alone the hun-
dreds of topics in the full book. The higher-level problem of identifying neigh-
borhoods, for instance finding all the topics two hops away from the target topic
Paradoxes,isverydifficult.
675
i
i
i
i
i
i
i
i
676 27. Visualization
Infinity - Lewis Carroll
Infinity - Zeno
Infinity - Paradoxes
Infinity - Halting problem
Zeno - Lewis Carroll
Paradoxes - Lewis Carroll
Paradoxes - Epimenides
Paradoxes - Self-ref
Epimenides - Self-ref
Epimenides - Tarski
Tarski - Epimenides
Halting problem - Decision procedures
Halting problem - Turing
Lewis Carroll - Wordplay
Tarski - Truth vs. provability
Tarski - Undecidability
Figure 27.1. Keeping track of relationships between topics is difficult using a text list.
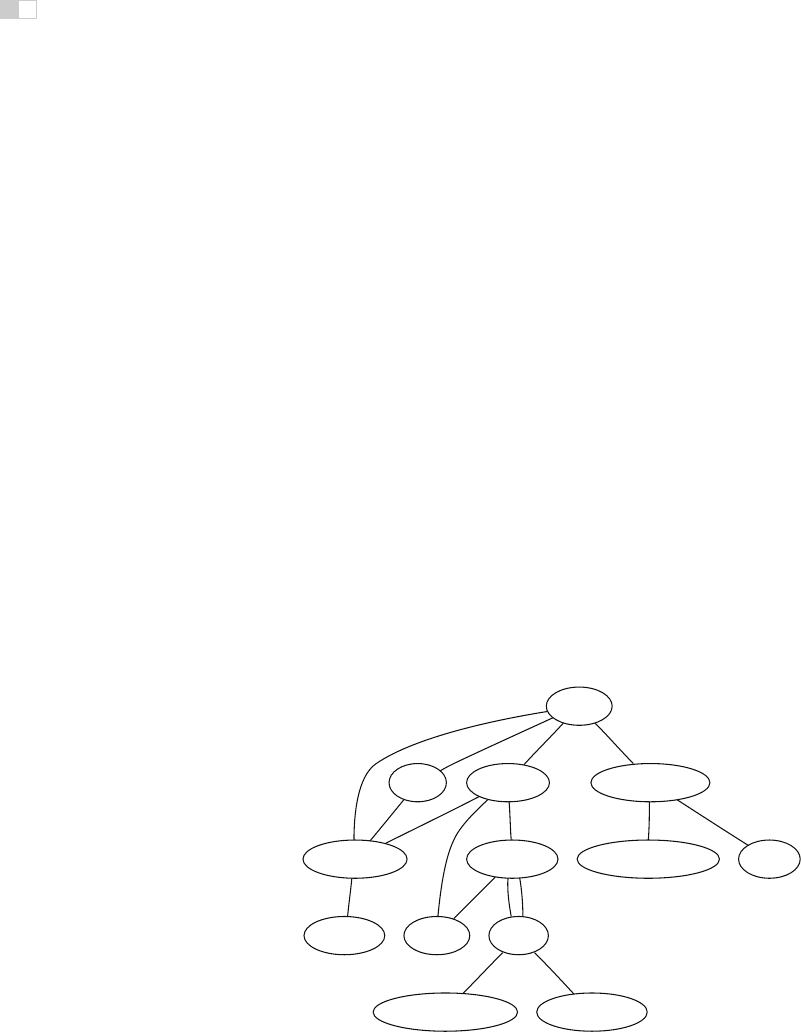
Figure 27.2 shows an external visual representation of the same dataset as a
node-link graph, where each topic is a node and the linkage between two topics
is shown directly with a line. Following the lines by moving our eyes around the
image is a fast low-level operation with minimal cognitive load, so higher-level
neighborhood finding becomes possible. The placement of the nodes and the
routing of the links between them was created automatically by the dot graph
drawing program (Gansner et al., 1993).
We call the mapping of dataset attributes to a visual representation a visual
encoding. One of the central problems in visualization is choosing appropriate
encodings from the enormous space of possibile visual representations, taking
into account the characteristics of the human perceptual system, the dataset in
question, and the task at hand.
Infinity
Halting problemZeno Paradoxes
Lewis Carroll TuringDecision procedures
Self-ref
Epimenides
Wordplay Tarski
Truth vs. provability Undecidability
Figure 27.2. Substituting perception for cognition and memory allows us to understand
relationships between book topics quickly.
Get Fundamentals of Computer Graphics, 3rd Edition now with the O’Reilly learning platform.
O’Reilly members experience books, live events, courses curated by job role, and more from O’Reilly and nearly 200 top publishers.

