NECKLINE BREAK…UP: 9/28/09
JTX, Jackson Hewitt Tax, was a stock I came across that was clearly showing signs of an impending move against most of its participants’ expectations, which were for a head-and-shoulders neckline break. This is a market extreme, however, where weak traders are prone to panic. As they wait anxiously for the share price to fall, bullish bargain longs have come in to push prices back into the envelope and into the value zone, while the indicators displayed bullish divergences. I felt like this provided me an advantage and an opportunity to catch an upside breakout. The charts that follow (Figures 12.1 through 12.3 ) clearly show a diminishing down thrust as bullishness began to build.
Figure 12.1 JTX weekly chart.
Weekly characteristics of the trade set-up: • First low made on an exhaustive sell-off (area A). • Up-trendline tested (area B). Notice the narrow bars, indicating a diminution in the down thrust. Chart created with TC2000® Software—www.worden.com.
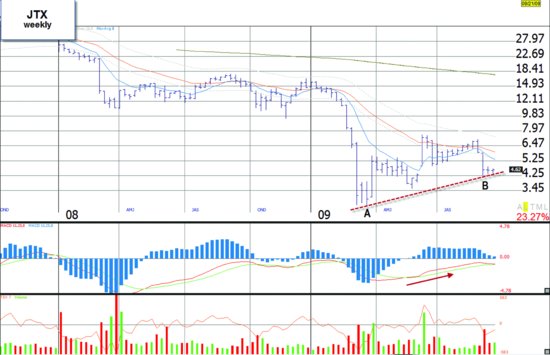
Figure 12.2 JTX daily chart.
Daily characteristics of the trade set-up: • Exhaustive sell-off to a low (bar A). • Retest of the low accompanied by a bullish MACD crossover. Prices entered a consolidation pattern within the value zone (area B). • Prices close into the value zone at the high of the day (bar C).
Figure 12.3 JTX daily follow-up.
Trade progress: • Monday, the stock gapped ...
Get Fly Fishing the Stock Market: How to Search for, Catch, and Net the Market's Best Trades now with the O’Reilly learning platform.
O’Reilly members experience books, live events, courses curated by job role, and more from O’Reilly and nearly 200 top publishers.

