MOVING AVERAGES
These popular technical indicators help identify trends. We calculate a simple moving average (SMA or MA) by averaging several data points. Commonly used time windows include 10, 20, 50, 100, or 200 bars in any time frame: monthly, weekly, daily, or intraday. Increasing the time window makes SMAs smoother but reduces their sensitivity. The shorter windows are more sensitive to price fluctuations. They are also more subject to whipsaws, which are meaningless reversals.
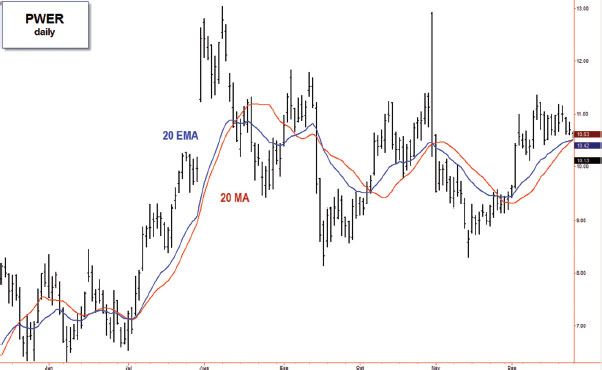
The problem with simple moving averages is that they do not sufficiently emphasize the effect of the most recent data. An exponential moving average (EMA) helps meet this challenge by giving more weight to recent prices, making it more responsive than an SMA (Figure 2.20). I prefer to use exponential moving averages and use the 50-, 21-, and 8-day EMAs in all time frames and in most of my trading strategies.
FIGURE 2.20 Simple versus exponential moving average.
PWER, daily, 20-day simple moving average (SMA) and 20-day exponential moving average (EMA).
Many of my trading signals are based on the behavior of moving averages. For short-term trading, I base my decisions on the EMA that best reflects the most recent trends. I pay special attention to the slope of the moving average, which identifies trends. I also note whether prices are above or below the moving average—above or below value.
Moving Average ...
Get Fly Fishing the Stock Market: How to Search for, Catch, and Net the Market's Best Trades now with the O’Reilly learning platform.
O’Reilly members experience books, live events, courses curated by job role, and more from O’Reilly and nearly 200 top publishers.

