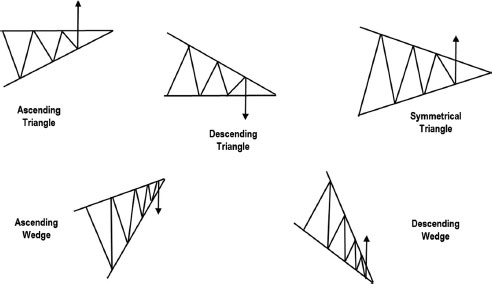
TRIANGLES
Another pattern I love to trade is a triangle formation. Triangles are price congestion areas in which prices oscillate within converging boundaries (see Figures 2.17 and 2.18). As a triangle develops, price bars shorten and volatility declines. As prices approach the apex of a triangle, they often stage a sharp breakout. Usually, when a triangle is approximately two-thirds complete, volume will pick up just prior to a breakout.
FIGURE 2.17 Triangle and wedge patterns.
The main types of triangles are ascending, descending, and symmetrical, along with rising and falling wedges. Ascending triangles tend to lead to upside breakouts, while descending triangles usually break to the downside. Symmetrical triangles can break either way, and thus, additional tools are required to help anticipate the direction of a breakout. In general, they are more likely to break in the direction of the prior trend and serve as continuation patterns. A rising wedge indicates diminishing bull power and calls for lower prices ahead. A falling wedge reflects fading selling pressure—a precursor to an upside reversal.
Get Fly Fishing the Stock Market: How to Search for, Catch, and Net the Market's Best Trades now with the O’Reilly learning platform.
O’Reilly members experience books, live events, courses curated by job role, and more from O’Reilly and nearly 200 top publishers.

