GAPS
A gap is a vertical void between two successive price bars or candles (Figure 2.14). For example, if a stock closes at $20, which is the high of the day, then opens the next day at $22 and never declines to $20 during that day, then we see a gap. Gaps tend to be driven by important events, such as earnings releases and merger agreements, announced after trading hours.
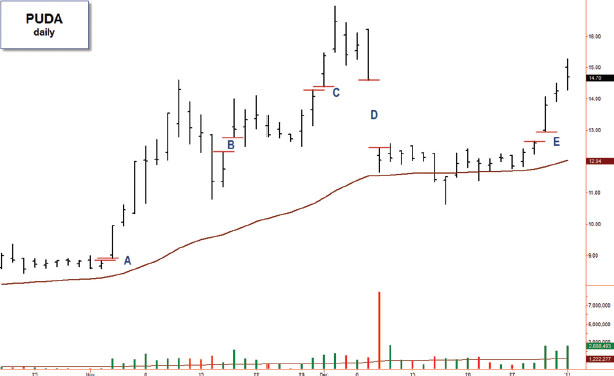
FIGURE 2.14 Types of gaps.
PUDA, daily, indicator set #2. Runaway gaps (A and E), common gaps (B and C), breakaway gap (D).
We often see gaps on the daily charts but only rarely on weekly and monthly charts. There are four main types of gaps: common, breakaway, runaway, and exhaustion. Some of these tend to augur powerful price trends.
Common Gaps
Common gaps are the most frequently seen gaps. They pop up in the normal course of trading, tend to be small, and are usually not accompanied by high volume. Common gaps tend to fill soon after they form. In an uptrend, traders often place limit orders to go long at the precise point at which the gap fills. When it does, it simply means that prices have returned to fill the missing segment.
Breakaway Gaps
Breakaway gaps occur when prices break out of a trading range or channel. They are much more significant than common gaps. You can see examples in Figures 2.14 and 2.16.
FIGURE 2.15 Burned the bulk of fuel in a single bar.
PUDA, daily, indicator set #1. • Prices ...
Get Fly Fishing the Stock Market: How to Search for, Catch, and Net the Market's Best Trades now with the O’Reilly learning platform.
O’Reilly members experience books, live events, courses curated by job role, and more from O’Reilly and nearly 200 top publishers.

