BOTTOMS
Bottom formations are in many ways the mirror images of the tops. After an extensive decline, a stock reaches a new low on high volume, marking an exhaustion move. It is followed by a moderate rally, and then, after several days and sometimes weeks, the stock slides back to test the first bottom. At this stage, we can get one of the two bottoming scenarios.
First, the stock may bottom out at a higher level but with lower volume, followed by accelerated buying. Alternatively, it may slide below the previous low but also on lighter volume. This divergence between price and volume patterns confirms a double bottom and leads to a reversal rally. These types of bottom formations are carefully watched by traders looking to catch upside reversals.
Double Bottoms
A double bottom forms a “W” pattern on a chart, with the second low retesting the first one on lighter volume. The rally from the second low is typically marked by an expansion of volume (Figure 2.10). This formation can lead to major upside reversals.
FIGURE 2.10 Bottoms up!
TRID, daily, Volume with a 50-day EMA. The second bottom (B) tested the first one (A) on lower volume with a weakening thrust. The key level here is the peak between the two bottoms (C). When prices rise above it on strong volume (area D), they confirm that the double bottom has given birth to a new uptrend.
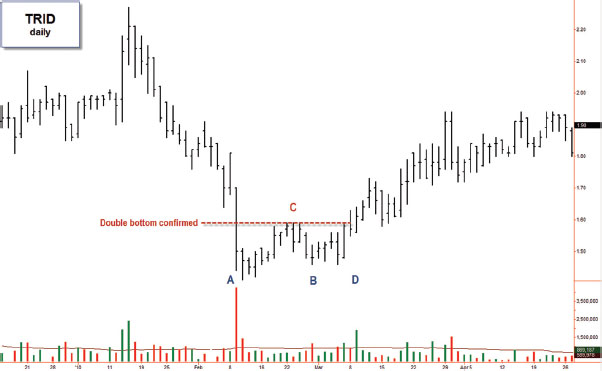
This chart pattern, when confirmed by ...
Get Fly Fishing the Stock Market: How to Search for, Catch, and Net the Market's Best Trades now with the O’Reilly learning platform.
O’Reilly members experience books, live events, courses curated by job role, and more from O’Reilly and nearly 200 top publishers.

