Chapter 10. VISUALIZING TIME AND SPACE
Updated 6/22/08
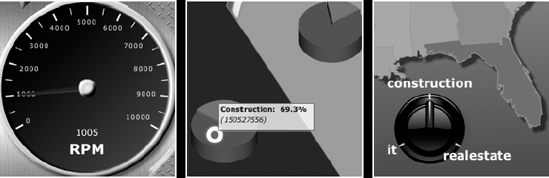
There is more to visualizations than just charts and graphs. There are all kinds of ways to visualize data. Component vendors, like ILOG, with their Elixir package, provide a bunch of Flex controls that present data effectively but don't look like what people expect to see in graphs. In this chapter, I'll show several examples of using these custom controls to present data in interesting combinations. We start off using gauges to present data in a visceral way, move on to some mapping demonstrations that show how to use maps to break up data geographically, then get into visualizing time, and ...
Get Flex 3 Component Solutions: Build Amazing Interfaces with Flex Components now with the O’Reilly learning platform.
O’Reilly members experience books, live events, courses curated by job role, and more from O’Reilly and nearly 200 top publishers.

