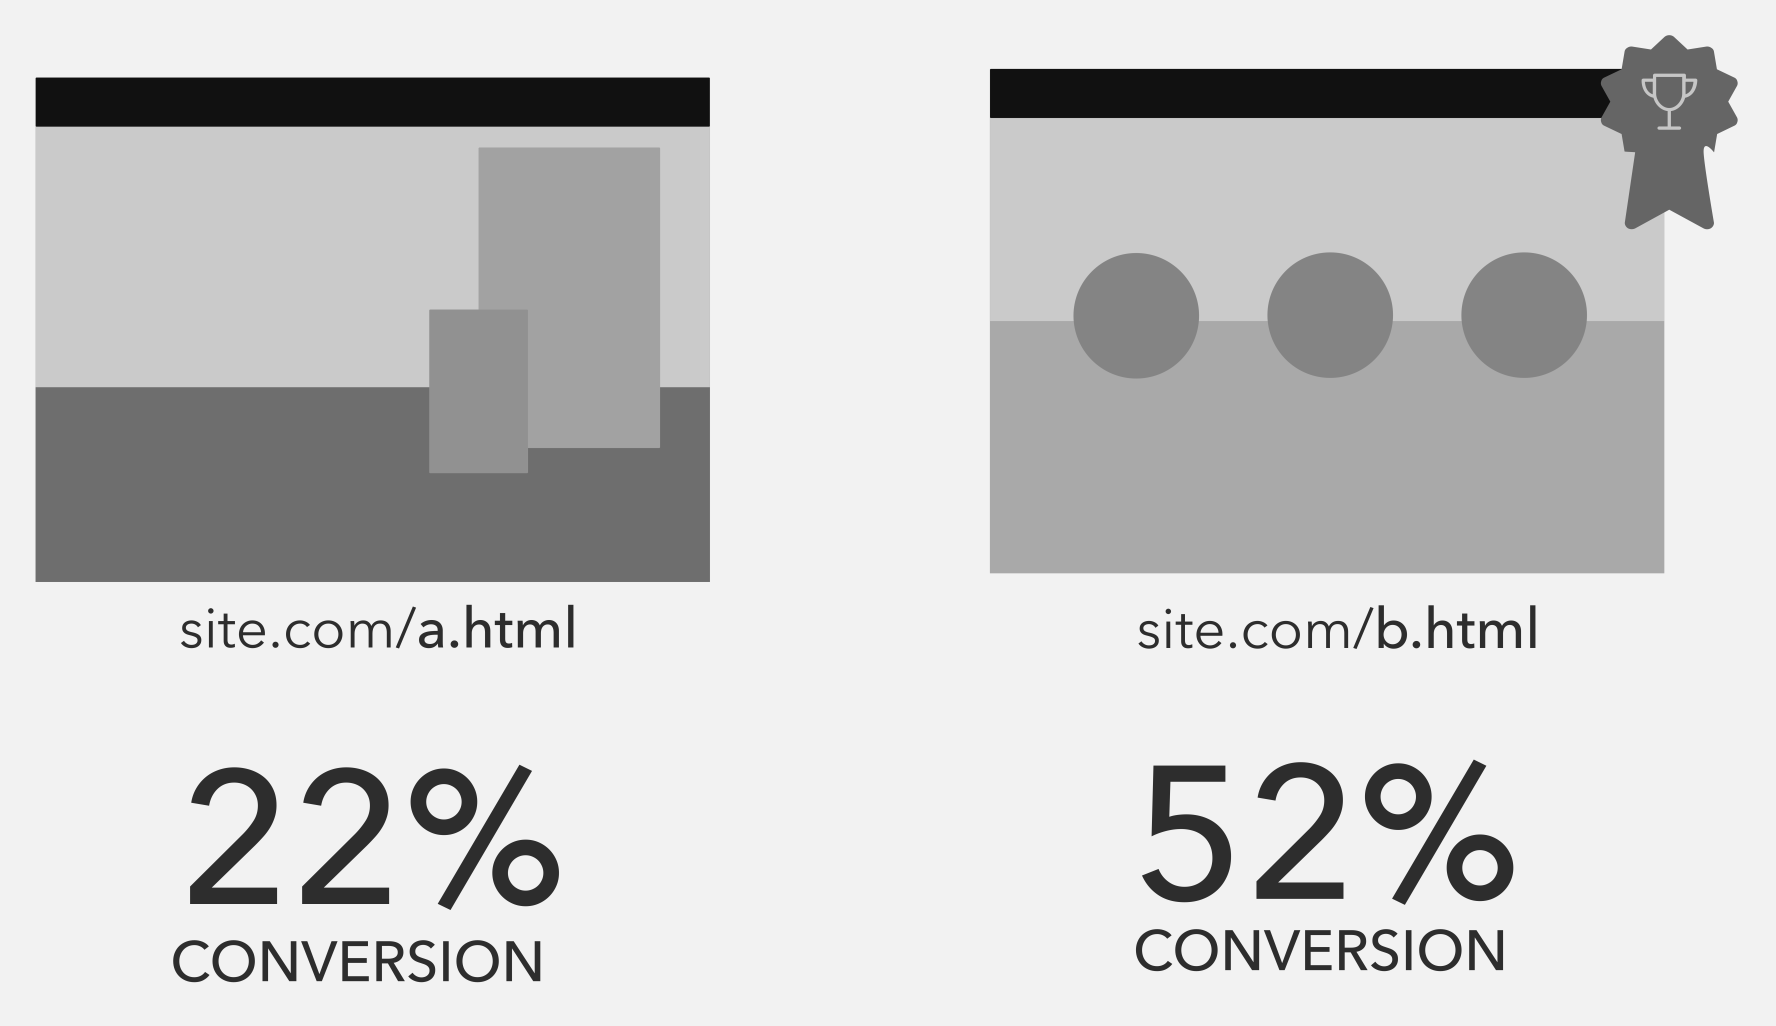
You might have gathered data from different analytic tools to better understand the user behavior. Organize this information, find patterns, and create graphs. Even information from surveys should be transformed into graphs and added to your report. And also add the results for A/B and multivariate tests. Usually, the tools you have chosen, such as Optimizely or VWO, might offer graphic results that you can add on your report. Make sure to add your analysis on the results, explaining the reasons that you decided to use those tools and what you were expecting. Try present result graphically:
Or even using smiles to represent the ...

