BINOMIAL TREES
The most basic method of presenting stock price movement is a binomial tree. It is very similar to the Brownian motion process we discussed in Chapter 3 except the step size can be of an arbitrary magnitude and the probability of an up or down movement does not necessarily have to be equal.
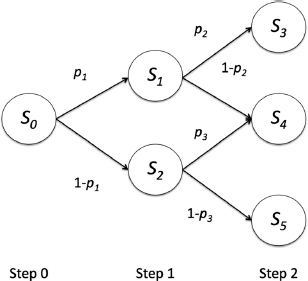
Figure 4.1 represents a basic recombinant binomial tree, a tree where two nodes can transition to the same node, with an initial starting stock price of S0 that transitions after step 1 to either price S1 with probability p1 or S2 with probability 1 – p1. Furthermore, you can see that from step 1, the price can take a total of 3 possible values at step 2. For the sake of simplicity let us start by examining the starting branch represented by S0, S1, and S2. Given this diagram, what would be the expected or average price of the stock? From statistics, we know the answer to be the value if the event occurs times the probability of occurrence plus the value if the event does not occur times the probability of the event not occurring (equation 4.1):
FIGURE 4.1 Basic recombinant binomial tree process where at each node the price can transition to two possible states. This is a recombinant tree because two nodes can transition to the same node in the next step.
![]()
If we were to sell an option, ...
Get Financial Simulation Modeling in Excel now with the O’Reilly learning platform.
O’Reilly members experience books, live events, courses curated by job role, and more from O’Reilly and nearly 200 top publishers.

