Chapter 8Statistical Measures of Dependence for Financial Data
David S. Matteson, Nicholas A. James and William B. Nicholson
Cornell University, USA
8.1 Introduction
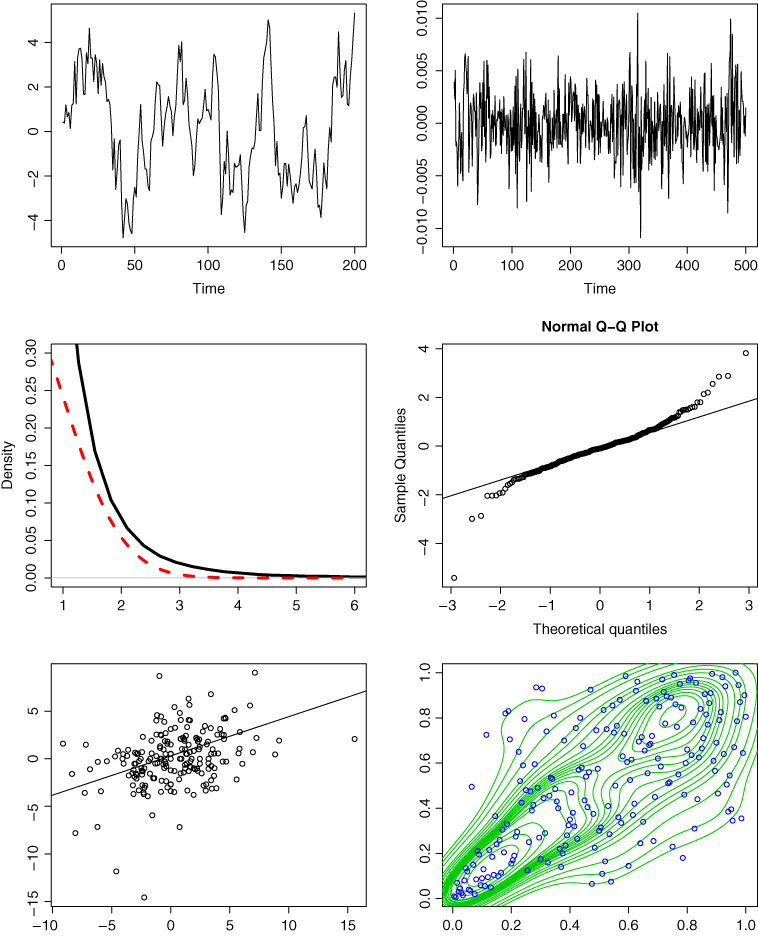
The analysis of financial and econometric data is typified by non-Gaussian multivariate observations that exhibit complex dependencies: heavy-tailed and skewed marginal distributions are commonly encountered; serial dependence, such as autocorrelation and conditional heteroscedasticity, appear in time-ordered sequences; and nonlinear, higher-order, and tail dependence are widespread. Illustrations of serial dependence, nonnormality, and nonlinear dependence are shown in Figure 8.1.

Figure 8.1 Top left: Strong and persistent positive autocorrelation, that is, persistence in local level; top right: moderate volatility clustering, that is, i.e., persistence in local variation. Middle left: Right tail density estimates of Gaussian versus heavy- or thick-tailed data; middle right: sample quantiles of heavy-tailed data versus the corresponding quantiles of the Gaussian distribution. Bottom left: Linear regression line fit to non-Gaussian data; right: corresponding estimated density contours of the normalized sample ranks, which show a positive association that is stronger in the lower left quadrant compared to the upper right.
When data are assumed to be jointly Gaussian, all dependence is linear, and therefore only ...
Get Financial Signal Processing and Machine Learning now with the O’Reilly learning platform.
O’Reilly members experience books, live events, courses curated by job role, and more from O’Reilly and nearly 200 top publishers.

