Chapter 20The Empirical Test of the Distribution of Loan Portfolio Losses
This note reports the results of a test of the portfolio loss distribution performed in 1993 by Patrick McAllister of Federal Reserve Bank. The test is based on the realization that it is not possible to obtain a sufficiently long time series of loan losses on a single loan portfolio, and that the only meaningful way of testing the distribution of loan losses is by using a cross-sectional sample of data on many portfolios.
By law, every U.S. bank must report to the Federal Reserve Bank its actual losses for the previous year. The data used in the study consisted of the reported gross losses on commercial and industrial loans for small and medium-sized banks over the period 1984–1991 on some 4,000 banks. Altogether, the sample contained about 23,000 data points, each data point being the actual gross loss of a given bank in a given year.
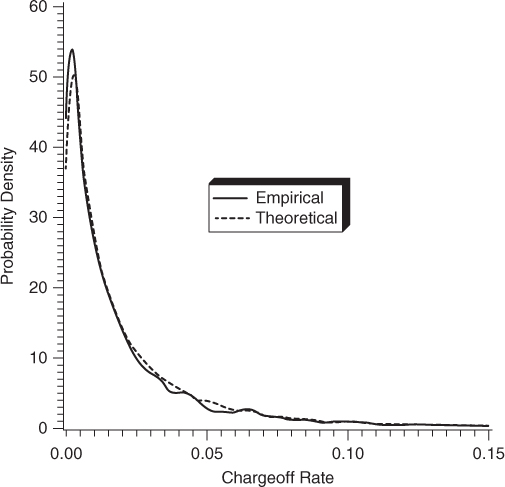
The data points were plotted in the graph, using the kernel method of sample density estimation (see Figure 20.1). On the horizontal axis is the gross loss as a fraction of the bank portfolio: .05 is a loss of 5 percent of the portfolio value, .10 is a 10 percent loss, and so on. The vertical distance gives the number of observations of that size of loss. The graph is thus a histogram, plotting the frequency of gross loss of the given magnitude. This is the full line.
Get Finance, Economics, and Mathematics now with the O’Reilly learning platform.
O’Reilly members experience books, live events, courses curated by job role, and more from O’Reilly and nearly 200 top publishers.

