The first example - graph
As our first example, let's create a simple graph. Remember the Giraffe Graph we talked about? Let's create one that is shown in the following figure:
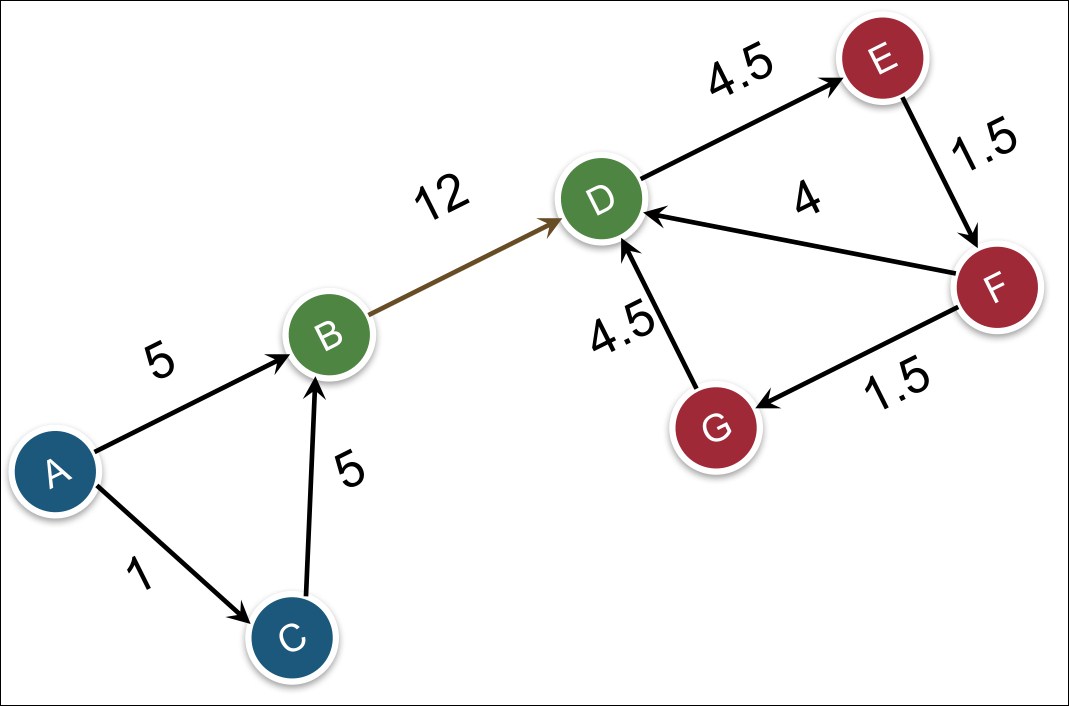
This is a graph from the lecture given by Prof. Jeffrey D. Ullman at Stanford University on graphs and social Networks (http://web.stanford.edu/class/cs246/handouts.html). It is a giraffe graph with two strong cliques connected by a weak edge. The numbers are the betweenness centrality of each node, as calculated by the G-N algorithm.
Note
Fun facts about betweenness centrality: It shows how many paths an edge is part of; that is, its relevancy. High betweenness centrality ...
Get Fast Data Processing with Spark 2 - Third Edition now with the O’Reilly learning platform.
O’Reilly members experience books, live events, courses curated by job role, and more from O’Reilly and nearly 200 top publishers.

