Diagramming a State Model
Now that you know how to recognize states and events, you can draw a diagram of the relationship between them.
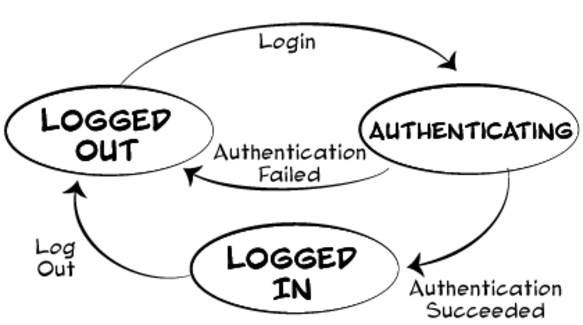
For example, a state model for the login example might look like the following. Note that states appear in circles, while arrows between the circles represent the possible transitions. The labels on the arrows are the events.
Creating a state model takes more than just noticing states and events. So many states and events exist even in a simple system that the task can quickly become overwhelming. Here are some strategies to keep you on track.
Narrow Your Focus
You can narrow the scope of your model by ...
Get Explore It! now with the O’Reilly learning platform.
O’Reilly members experience books, live events, courses curated by job role, and more from O’Reilly and nearly 200 top publishers.

