Lesson 18Programming PivotTables and PivotCharts
PivotTables are Excel's most powerful feature. They are an amazing tool that can summarize more than a million rows of data into concise, meaningful reports in a matter of seconds. You can format the reports in many ways, and include an interactive chart to complement the reports at no extra cost of time.
If you are not familiar with PivotTables, you are not alone. Surveys of Excel users worldwide have consistently indicated that far less than half of those surveyed said they use PivotTables, including people who use Excel throughout their entire workday. Because PivotTables are worth becoming familiar with, this lesson starts with an overview of PivotTables and PivotCharts, followed by examples of how to create and manipulate them programmatically with VBA.
Creating a PivotTable Report
Suppose you manage the clothing sales department for a national department store. You receive tens of thousands of sales records from your stores all over the country, with lists that look similar to Figure 18.1. With lists this large, it's impossible to gain any meaningful insight into trends or marketing opportunities unless you can organize the data in a summarized fashion.
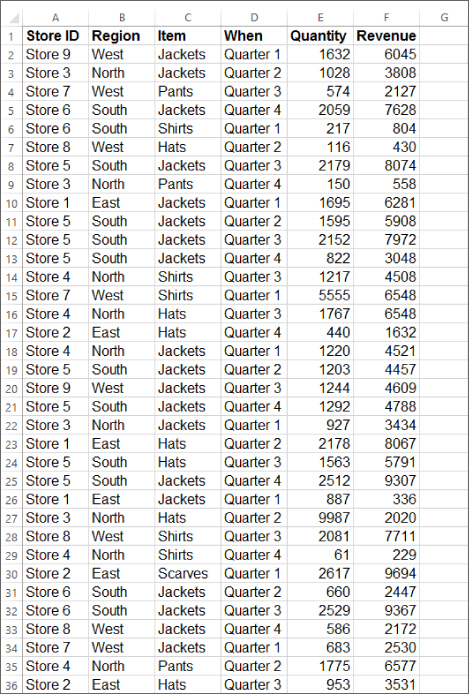
If you select a single cell anywhere in the list, such as cell E7, which is selected in Figure 18.2, you can create a PivotTable by selecting the Insert ...
Get Excel VBA 24-Hour Trainer, 2nd Edition now with the O’Reilly learning platform.
O’Reilly members experience books, live events, courses curated by job role, and more from O’Reilly and nearly 200 top publishers.

