Name
Chart → Source Data
Synopsis
The Chart → Source Data option allows you to make modifications to the data ranges and data orientations for the selected chart. When you select this option, the Source Data dialog displays, as shown in Figure 10-16.
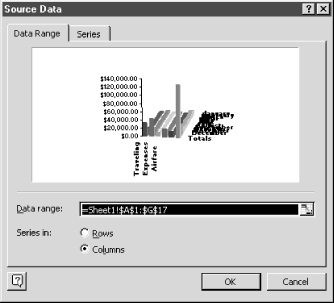
Figure 10-16. Source Data dialog
Data Range Tab
The Data Range tab is used to specify the data range that is used to create the chart and whether the data is placed on the chart based upon the values in the rows or columns of the worksheet. The orientation (Series in radio buttons) that you select determines the values selected on the Series tab. For example, if you select the Rows radio button, by default Excel uses the first cell in each row as the series name for the chart. This is the information that appears in the legend.
Series Tab
The Series tab, shown in Figure 10-17, allows you to customize the series names for your chart. To change a series name, highlight the name in the series list and type the desired name in the Name field. You can also click on the Collapse Dialog button and select another field that contains the desired series name. Keep in mind, any modifications made to the series names on this tab do not affect the values in the worksheet.
The “Category (X) axis labels” field indicates the location of the X axis labels for your chart. You can change the reference by clicking on the Collapse Dialog button.
Figure 10-17. Series ...
Get Excel 2000 in a Nutshell now with the O’Reilly learning platform.
O’Reilly members experience books, live events, courses curated by job role, and more from O’Reilly and nearly 200 top publishers.

