Appendix
Table A.1: Standardized Normal Distribution
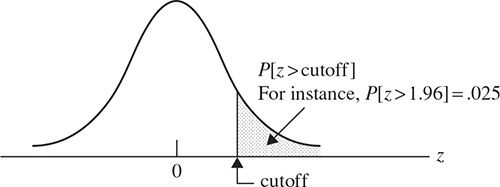
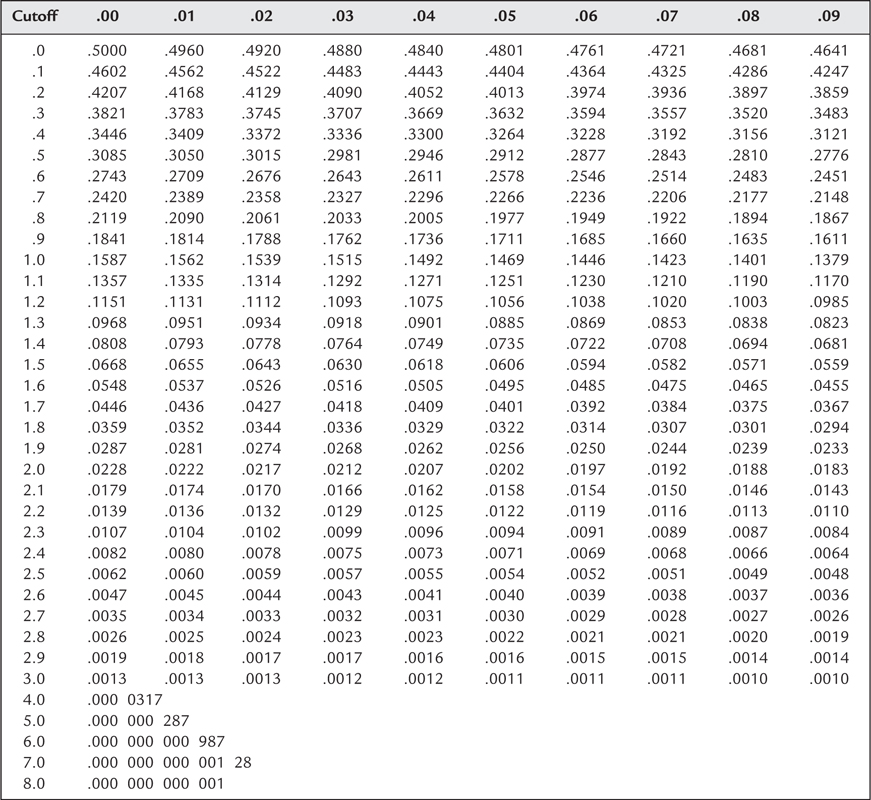
Table A.2: Student’s t Distribution
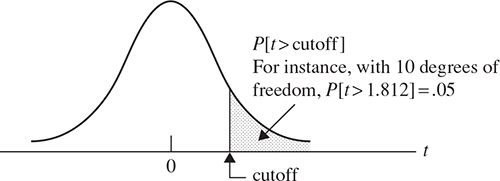
Degrees of Freedom |
Probability of a t Value Larger Than the Indicated Cutoff |
||||
0.10 |
0.05 |
0.025 |
0.01 |
0.005 |
|
1 |
3.078 |
6.314 |
12.706 |
31.821 |
63.657 |
2 |
1.886 |
2.920 |
4.303 |
6.965 |
9.925 |
3 |
1.638 |
2.353 |
3.182 |
4.541 |
5.841 |
4 |
1.533 |
2.132 |
2.776 |
3.747 |
4.604 |
5 |
1.476 |
2.015 |
2.571 |
3.365 |
4.032 |
6 |
1.440 |
1.943 |
2.447 |
3.143 |
3.707 |
7 |
1.415 |
1.895 |
2.365 |
2.998 |
3.499 |
8 |
1.397 ... | ||||
Get Essential Statistics, Regression, and Econometrics now with the O’Reilly learning platform.
O’Reilly members experience books, live events, courses curated by job role, and more from O’Reilly and nearly 200 top publishers.

