APPENDIX G
Time Series Charts of Unleveraged, Inflation-Adjusted Discount Rate Estimates
FIGURE G.1 Comparison of Real Unleveraged Discount Rates, Group 1: Alcoa (AA), Boeing (BA), Bristol-Myers Squibb (BMY), Burlington Northern Santa Fe (BNI), Conagra (CAG)
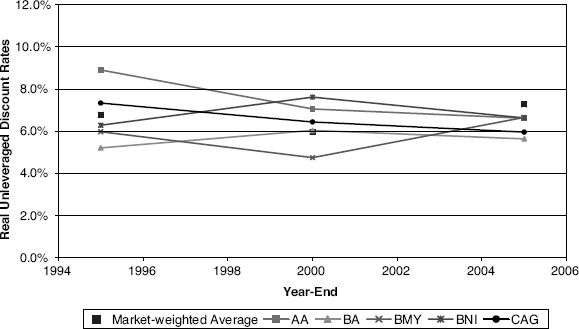
FIGURE G.2 Comparison of Real Unleveraged Discount Rates, Group 2: Cardinal Health (CAH), Caterpillar (CAT), Campbell Soup (CPB), Chevron (CVX), DuPont (DD)
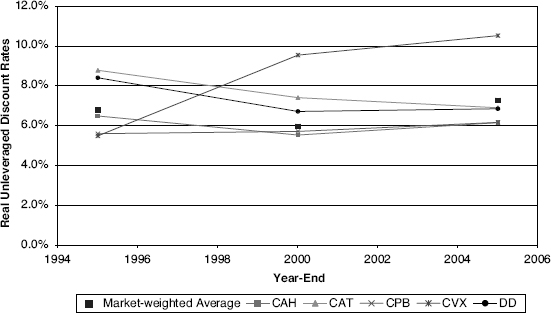
FIGURE G.3 Comparison of Real Unleveraged Discount Rates, Group 3: Disney (DIS), Dow Chemical (DOW), Eastman Kodak (EK), FedEx (FDX), General Dynamics (GD)
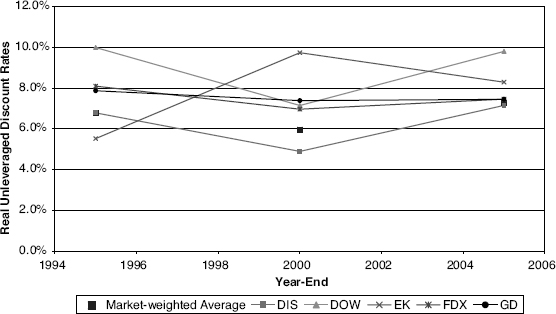
FIGURE G.4 Comparison of Real Unleveraged Discount Rates, Group 4: General Electric (GE), Home Depot (HD), Harrah’s Entertainment (HET), Honeywell (HON), Hewlett-Packard (HPQ)
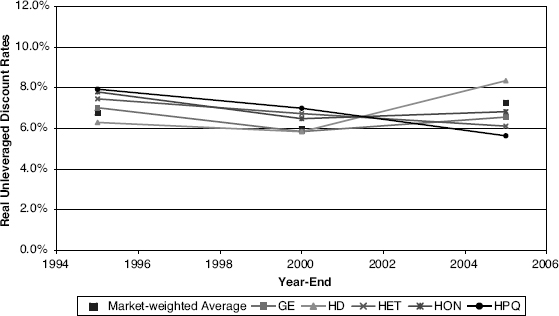
FIGURE G.5 Comparison of Real Unleveraged Discount Rates, Group 5: IBM (IBM), Intel (INTC), Johnson & Johnson (JNJ), Kellogg (K), Kimberly-Clark (KMB)
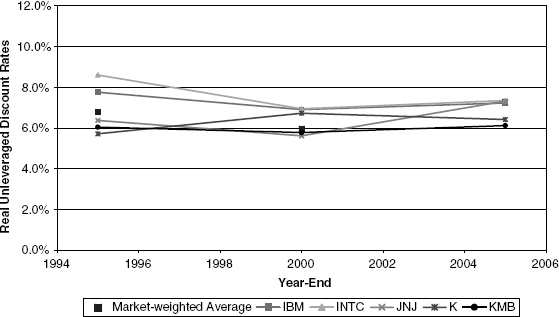
FIGURE G.6 Comparison of Real Unleveraged Discount Rates, Group 6: Coke (KO), McDonald’s ...

