Chapter 4. Manufacturing and Industry
The application of IoT concepts to industrial environments has attracted a lot of interest. GE has coined the term âIndustrial Internet,â IBM is pushing the concept of âsmart factories,â German industry uses the term âIndustry 4.0,â while Airbus talks about the âfactory of the future.â Precise definitions are few and far between, and many of these concepts go beyond the notion of next-generation manufacturing to include logistics and supply chain management, mining and offshore drilling, and even smart grids and building automation.
In some cases, a worthwhile distinction is made between the Industrial IoT and the Consumer IoT. As we saw in Chapter 1, our definition of Enterprise IoT is less about specific application domains and more about openness and integration maturity. In this chapter, we will take a closer look at some of the more industrial applications of Enterprise IoT, starting with a discussion about how IoT will transform manufacturing from the perspective of both product engineering and production technology.
Integrated Production for Integrated Products
We believe that the IoT will have two main areas of impact on the current manufacturing landscape. The first concerns the organizational structure that is required to produce truly integrated IoT solutions. As discussed in Chapter 1, the IoT involves a clash between two worlds in which those in the machine camp and those in the Internet camp will be required to work together to create products that combine physical products with Internet-based application services. In an IoT world, many companies will discover that being just a manufacturing company or just an Internet company will no longer be sufficient; they will need to become bothâor become subsumed in an ecosystem in which they play a smaller role.
For manufacturing companies, this means they will have to build up capabilities in IoT service development and operation; in other words, the achievement of âintegrated production for integrated productsâ (Figure 4-1). Many of these companies will find this challenging, because it is not in their DNA. Nor is it just a question of developing additional IT skills (beyond the embedded skills most will likely already have); value propositions will have to evolve too, which will necessitate change in almost all parts of the organization, from engineering to sales right through to aftermarket services.
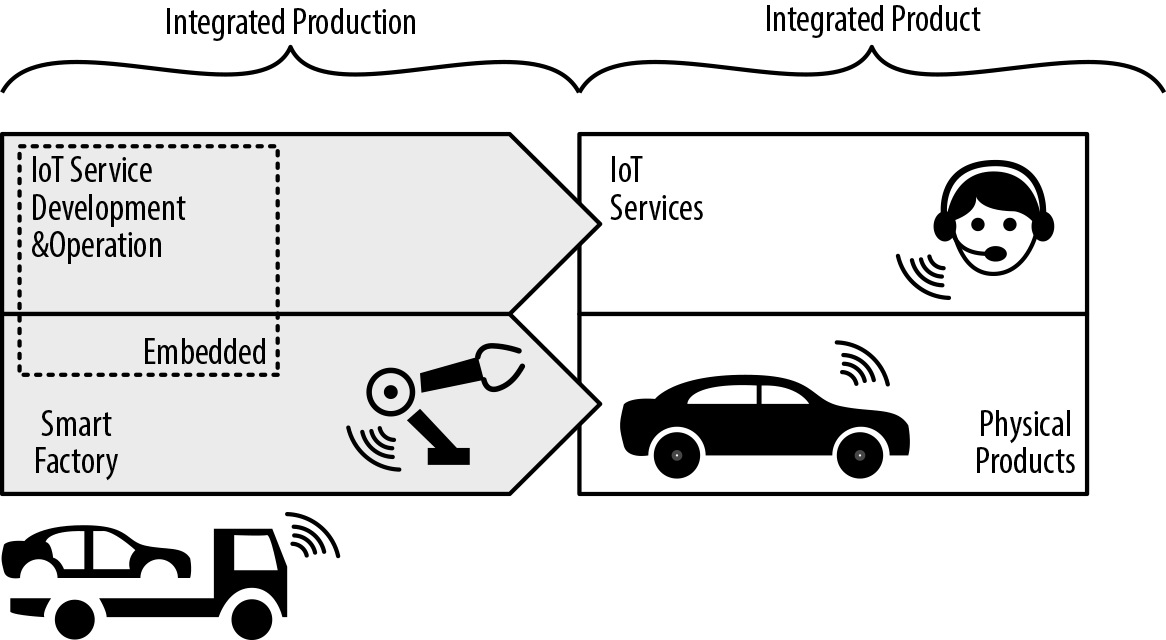
Figure 4-1. Integrated production of integrated products
The second area where the IoT will have a significant impact on manufacturers is of course in the area of manufacturing technologies. As promoted by initiatives such as the German governmentâs Industry 4.0 strategy, connected manufacturing equipment, connected logistic chains, cyberâphysical systems, and Big Data-based analytics of production processes will help improve the way the physical parts of a connected IoT solution are produced. In a sense, this second area of impact can benefit from the first; what might be considered an integrated product to one company (e.g., a machine component manufacturer) is an advanced production technology to another (e.g., a manufacturer using the connected machine component in their assembly lines).
Drawing on these two key assumptions, Figure 4-2 provides a detailed overview of the manufacturing value chain of tomorrow. Note, in particular, the integration of IoT service implementation with IoT service operation.
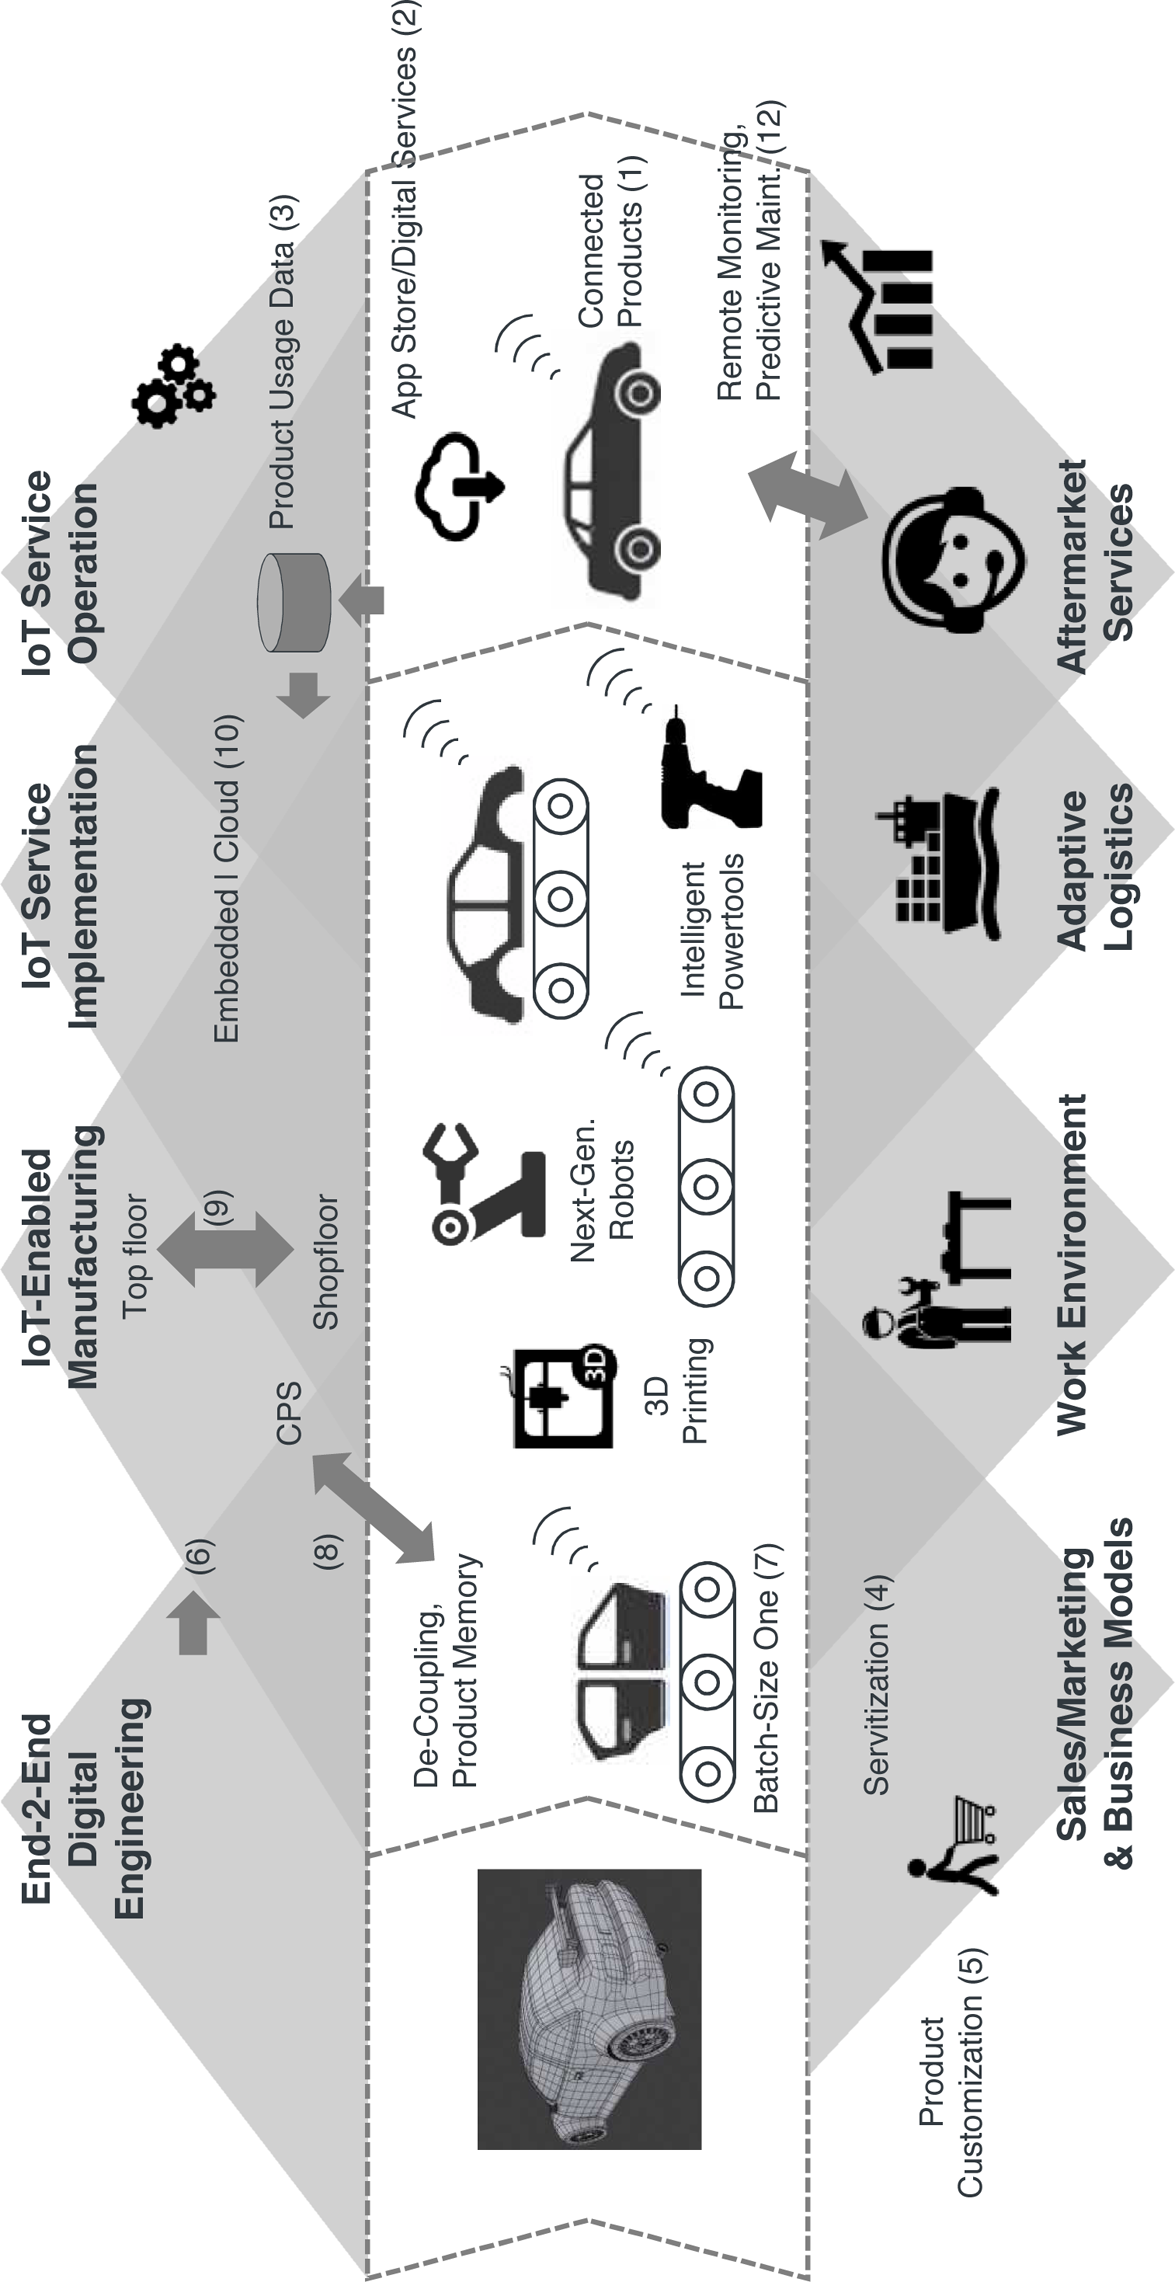
Figure 4-2. Factory of the future, Industry 4.0, and the IoT
Before we look at how new production technologies will help improve manufacturing processes in the future, we need to briefly recap on what we know about the products of tomorrow; because, ultimately, the nature of these new products will have an impact on all other processes, from design to manufacturing right through to aftermarket services.
As discussed in Chapter 1, the assumption is that the products of the future will be connected (1) and become part of what we call the Internet of Things. We are also assuming that products will have embedded computing capabilities, enabling local intelligence and digital services (2). These digital services can be applications or content. For example, a car app store might provide a new navigation application, and the application itself allow the purchase of additional maps.
The combination of physical product and connected backend service will have a sizeable impact on product design. First, itâs possible that the design of the physical products themselves will change. For example, a productâs embedded display and keys could be dropped in favor of a mobile app. This would constitute a significant redesign of the productâs physical components. Second, products will be increasingly reliant on remote services, often in the cloud. Building these kinds of related IT services is not usually part of the traditional product engineering process. It will require someone to oversee the design of both elementsâthe physical product and its associated backend software services or platformâ and ensure that everything results in a nicely integrated product offering. See also our discussion in âClash of Two Worlds: Machine Camp Versus Internet Campâ.
Finally, connected products will provide a rich source of product usage data (3), which will serve as input for all other stages of the value chain, from sales, marketing, and product design through to manufacturing and after-sales services.
Sales/Marketing and New Business Models
New business models made possible by the emergence of the IoT will drive the future of product design. These business models will also have a significant impact on the sale and marketing of these products. As we discussed in Chapter 1, servitization (4) involves transforming a companyâs business model from one focused on selling physical products to one focused on services. For example, Rolls-Royce now earns roughly 50% of its revenue from servicesâby leasing jet engines to airlines on a âpower-by-the-hourâ basis, for example. This completely transforms the way in which products are sold and serviced.
However, it also means that sales teams will have to completely adjust their sales strategy. Incentive models based on upfront revenues will have to be revisited in favor of models that support recurring revenues, which allow for the stabilization of revenue forecasting.
Marketing teams will be able to leverage detailed product usage data (3) to drive marketing campaigns and define precise market segments. This direct link to the customer via the product can be of huge value for sales and marketing teams, making it easier for them to run targeted cross-selling and up-selling campaigns, for example.
Another key driver is product customization (5). More and more markets are demanding fully customized products. Ranging from custom-designed sneakers to cars built to customer specifications, this trend has two key implications. First, products are now being sold before they have been produced, and not the other way around. In Figure 4-2, we can see that sales comes before manufacturing, contrary to what we would normally expect. Second, this trend has a major impact on the manufacturing process itself; for example, âbatch size 1â production is a basic requirement of custom manufacturing (7).
End-to-End Digital Engineering
Digital engineering is a reality in most large manufacturing organizations today. These organizations have invested heavily in the integration of tool chains that support the entire product lifecycle. Computer-aided design (CAD) tools are used for product design and simulation, computer-aided production engineering (CAPE) tools support the design and simulation of manufacturing systems, while manufacturing execution systems (MES) tools help ensure the integration of product data right across the product lifecycle while also supporting resource scheduling, order execution and dispatch, material tracking, and production analysis.
3D models are also playing an increasingly important role that transcends the traditional domain of product design. Modern 3D PLM systems have integrated CAD design data with bill of material (BOM) data and other information to better support end-to-end digital engineering. The 3D model becomes the master model for all product-related data (6). 3D data also support the simulation of entire assembly lines, helping to optimize manufacturing efficiency and minimize the risk of costly changes after the assembly line has been set up.
One of the key benefits promised by the IoT is that it will help link the virtual world with the physical world. 3D models are a very important type of virtual model. The use of sensors, lasers, and localization technologies has enabled the creation of links between the virtual 3D world and the physical world. For example, Airbus uses 3D data to emit laser projections over aircraft bodies in order to guide assembly line workers [AB1]. Similarly, at the Hannover industrial trade fair in 2014, Siemens showcased a complete (physical) assembly line with an associated virtual model in their 3D factory simulation environment. Sensors on the moving parts of the assembly line send movement data back to the IT system, which then updates the position data in the 3D system in real time. As can be seen in Figure 4-3, the virtual 3D model is fully in synch with the actual production line.
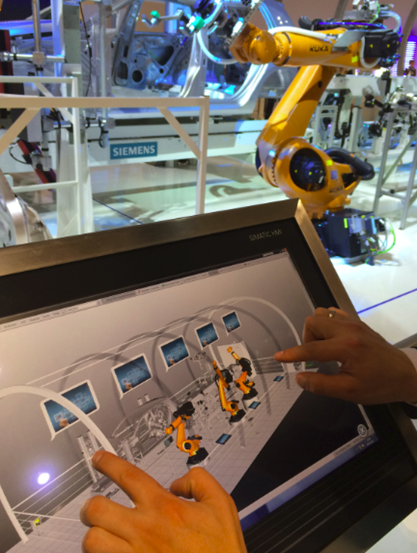
Figure 4-3. 3D simulation synchronized with physical assembly line, as showcased by Siemens at HMI 2014
Augmented reality is another interesting area in which we are seeing convergence between 3D models and the physical world, especially in the context of training and quality assurance. For example, Airbusâs mixed reality application (MiRA) allows shopfloor workers to access a 3D model using a specialized device consisting of a tablet PC with integrated sensor pack. Leveraging location devices on the aircraft and on the tablet PC, MiRA can show a 3D model of the aircraft from the user`s perspective, âaugmentingâ it with additional, production-related data. Airbusâs adoption of MiRA has allowed them to reduce the time needed to inspect the 60,000â80,000 brackets in their A380 fuselage from three weeks down to three days [AB1].
Manufacturing
Weâve already discussed the need to become increasingly flexible and capable of supporting highly customizable products. From a manufacturing point of view, this means that concepts like âbatch size 1â (7) and âone-piece flowâ are becoming even more important. One of the visions of Industry 4.0 is that it will enable the decoupling of production modules to support more flexible production. One potential way of achieving this is through the use of product memory. Products, semifinished products, and even component parts will be equipped with an RFID chip or similar piece of technology that performs a product memory function (8). This product memory can be used to store product configuration data, work instructions, and work history. Instead of relying on a central MES system to manage all aspects of production, these intelligent products can tell the production modules themselves what needs to be done. This approach could be instrumental in paving the way for cyberâphysical systems (CPS), another key element of the factory of the future. This is discussed in more detail in âCase Study: Smart Factoryâ.
Improved âtop floor to shop floorâ integration is another important benefit promised by Industry 4.0 (9). Concepts like manufacturing operations management (MOM) have emerged to help integrate and analyze data from different levels, including the machine, line, plant, and enterprise level. With IoT, additional data will be provided from the machine level directly.
The extent to which the IoT movement will deliver new technologies and standards in this area also makes for an interesting discussion. For example, one already widely established standard for integrating machine data is OPC/OPC-UA [OP1]. It remains to be seen whether OPC and similar standards will be simply relabeled as âIoT-compliant,â or whether an entirely new set of standards will emerge.
Similarly, many machine component suppliers are already providing either standards-based interfaces (e.g., OPC) or proprietary interfaces (e.g., DB-based) for accessing machine data. Again, the question is whether it is necessary to invent new standards and protocols, or whether in this particular case it is more important to drive integration at a higher level, based on an enterprise application integration (EAI) or service-oriented architecture (SOA) approach, for example. One of the main issues here seems to be heterogeneityâthe very issue that EAI and SOA were specifically developed to address.
Another interesting discussion relates to the integration that needs to take place one level down (i.e., at the bus level). For decades, industrial bus systems (EtherCAD, Modbus, Profibus, SERCOS, etc.) have been used for production automation, enabling communication with and control of industrial components, often via programmable logic controllers (PLCs). Most of these bus systems are highly proprietary, because they are required to support extremely demanding real-time requirementsâwhich is difficult to achieve using the Internet Protocol (IP). This, again, poses a problem for the overall vision promised by the IoTâthe IP-enabled integration of devices of all shapes and sizes. So it will be interesting to see if the efforts of the IEEEâs Time-Sensitive Networking (TSN) task group [TS1]) succeed in establishing technologies for machine and robot control based on IP networking standards.
Other important examples of technologies that could become relevant for the factory of the future include:
- 3D printing
Especially in the area of prototyping and the production of nonstandard, low-volume parts, 3D printing is set to become very important in the not-so-distant future.
- Next-generation robots
Robots are already being used in many high-volume production lines today. In terms of how they will evolve, one interesting area is the ability of robots to work in dynamic environments and ensure safe collaboration with humans.
- Intelligent power tools
As we will see in more detail in Part III, power tools such as those used for drilling, tightening, and measuring are becoming increasingly intelligent and connected. The tracking and tracing of these tools is an important IoT use case.
- High-precision indoor localization
The tracking and tracing of moving equipment and products in a factory environment will be primarily achieved through the use of high-precision indoor localization technology.
IoT Service Implementation
The ability to combine manufacturing with IT service implementation is not yet widely established. Apple is still seen as a leader in the field, because of its ability to produce physical products (iPod, iPhone, etc.) that are tightly integrated with IT services (iTunes, iCloud, etc.). As we discussed in Chapter 1 in the introduction, many manufacturers today are still struggling to establish organizational structures where both capabilities are available and integrated to a sufficient degree. Regardless, the ability to combine physical product design and manufacturing with embedded, cloud/backend-based software service development is seen as a key capability of the IoT.
This integration must take place on both an organizational and technical level. The Ignite | IoT Methodology described in Part II specifically addresses this issue from an IT service implementation perspective.
IoT Service Operations
The ability to make the transition from manufacturer to service operator is essential to the achievement of success in an IoT world. This applies not just to the technical operation of the service, but also to the operation of a business organization capable of supporting strong customer relationships. The DriveNow car-sharing service discussed in Chapter 1 is a good example of this. Formed as a result of a joint venture between BMW and Sixt, the service successfully combines BMWâs car manufacturing expertise with Sixtâs expertise in running a considerably more service-oriented car rental operation.
Another good example is the eCall service, an IoT service that requires a call center capable of manually processing incoming distress calls from vehicles and/or vehicle drivers. For more information, see Chapter 5.
Apart from the business operation itself, there is the question of operating the IT services associated with the IoT solution. Some of the capabilities required here include traditional IT operations capabilities, such as operating the call center application used in the eCall service described earlier. However, some of the capabilities required are also very IoT-specific. Managing remote connections to hundreds of thousands of assets and devices is challenging from an operational point of view, not least in terms of scalability and security.
Remote software distribution is another area worthy of discussion. It offers a huge opportunity for many manufacturers, but also requires the provision and operation of a suitable infrastructure. A good case in point is the recent recall of 1.9 million vehicles by a large OEM due to problems with the onboard software [TY1]. This OEM could have saved itself massive amounts of money if it had been able to distribute the required software update remotely. Smartphone platforms also provide a good insight into the challenges involved in running remote software updates on a very large scale. Although they are now much better at handling software updates than they were in the past, the situation is far from perfect and occasional problems still persist. In the case of in-car software, this would be unacceptable.
Aftermarket Services
In an era of IoT-fueled âservitizationâ especially, aftermarket services are becoming increasingly important.
Remote condition monitoring (RCM) is one of a number of basic services that can have a fundamentally positive impact on customer service quality. The ability to access product status information in real time is invaluable for support services, not least because it makes for much more efficient root cause analysis and solution development. RCM is not new; it is most likely one of the most widely adopted M2M use cases. The challenge for many large manufacturers today is one of heterogeneity. A large manufacturer with thousands of product categories can easily have hundreds of different RCM solutions. The issue here is not so much the need for new and improved RCM for next-generation products, itâs about the implementation of efficient IT management solutions that are capable of managing this heterogeneity. This could be achieved by automating virtualization and improving secure connection management, for example.
The next step in the evolution of RCM is predictive maintenance. The use of sensors for thermal imaging, vibration analysis, sonic and ultrasonic analysis, oil and liquid analysis, as well as emission analysis allows the detection of problems before they even occur. For buyers of industrial components, predictive maintenance has the potential to significantly improve operational equipment efficiency (OEE). For end-consumer products, predictive maintenance is a great way of improving customer service and ensuring extra sales or commission (âYou should replace your brakes within the next 5,000 kilometers. We can recommend a service station on your way to work.â).
In general, product usage data will really help with the identification of cross-selling and up-selling opportunities. When combined with the ability to sell additional digital services, the proposition becomes even more compelling. For example, the performance of many car engines today is controlled by software. We could have a scenario where a car manufacturer produces one version of an engine (the high-end version), and then uses configuration software to create a lower-performing version. The digital service in this case could be the option to temporarily upgrade engine performance for a weekend trip (âYou have just programmed your navigation system for a drive to the country. Would you like to upgrade your engine performance for this trip?â).
Naturally, this newly won customer intimacy will require solid security and reasonable data access policies in order to retain customer trust in the long term.
End-of-lifecycle data can be used for remanufacturing and recycling offers, or simply to make the customer an attractive product replacement proposals.
The boundary between IoT services and aftermarket services is not always clear. From our perspective, IoT services are part of the original value proposition. Take the eCall service, for example. In this case, the service is essentially the product that is being sold. Aftermarket services generally take the form of value-added services (which can also be IoT-based).
Work Environment
Some people are concerned that these new manufacturing concepts will threaten the workplace of the future, bringing with them increased automation and the wider use of robots. While there is strong evidence that automation may actually reduce the amount of tedious and repetitive labor, there is also an argument that work will become more specialized and thus more interesting and varied. In particular, the flexibility inherent in the factory of the future will demand an approach that is more geared toward problem solving and self-organization. Robots that help with strenuous, manual labor are viewed by many as an improvement for the work environment. Airbusâs wearable robotic devices or exoskeletons, which are intended to help with heavy loads and work in difficult spaces, provide a good case in point [AB1].
Adaptive Logistics and Value-Added Networks
Finally, one key element synonymous with the Industrial Internet and advanced Industry 4.0 concerns adaptive logistics and value-added networks. The idea here is that traditional supply chains will evolve into value networks. For example, these networks will need to have structures that are capable of adapting rapidly in order to address batch-of-one requests between different customers and suppliers.
The ability of the IoT to monitor containers, trucks, trains, and other elements of modern transportation systems in real time will also help optimize logistics processes. Improved integration at the business process level will also help make logistics systems more adaptive.
Other Industrial Applications
Of course, the Industrial IoT presents many opportunities beyond those related purely to manufacturing. Some of the opportunities covered in this book include:
- Mobile equipment tracking
The tracking of industrial equipment and containers was one of the first application areas of telematics and M2M, and will evolve and contribute to value-added IoT solutions. The Intellion, Kärcher, and PurFresh case studies at the end of this chapter provide some great examples of this.
- Nuclear physics research
As we will see in the CERN case study, one of the areas in which sensor technologies are most widely used is in nuclear physics research, where they are deployed to reconstruct digital images of nuclear collisions.
- Energy
Because it is such a large application domain for IoT, we have dedicated an entire chapter to energy (see Chapter 3).
And of course there are many other potential applications of the Industrial IoT, from cross-energy management (see Chapter 3) to mining right through to offshore drilling.
Industry Initiatives
Given the momentum of the Industrial IoT and its related concepts, it is no surprise that the raft of industry initiatives in this area has become a little confusing. Some examples of these initiatives include the Smart Manufacturing Leadership Coalition (SMLC), the Open Connect Consortium (OIC), the European Research Cluster on the Internet of Things (IERC), the M2M Alliance, and the IEEE Industrial Working Group, to name just a few. In this section, we will focus on two initiatives that are gathering strong momentum: Industry 4.0 and the Industrial Internet Consortium.
Industry 4.0
Industry 4.0 began as a special interest group supported by German industry heavyweights and machine manufacturers. Its goal was to promote the vision of a fourth industrial revolution, driven by the digitization of manufacturing. Today, the initiative is mostly led by the Industry 4.0 Platform, a dedicated grouping comprising industry members such as ABB, Bosch, FESTO, Infineon, PHOENIX CONTACT, Siemens, ThyssenKrupp, TRUMPF, Volkswagen, and WITTENSTEIN; as well as IT and telecoms companies such as Deutsche Telekom, HP, IBM Germany, and SAP. Government agencies and industry associations have also lent their support. The main focus of Industry 4.0 is on smart factories and related areas such as supply chains and value networks, as opposed to wider Industrial IoT use cases such as smart energy, smart building, and more. The initial report that defined the Industry 4.0 vision [I41] defined use cases such as resilient factory, predictive maintenance, connected production, adaptive logistics, and others.
The following interview provides some background on the adoption of Industry 4.0 at Bosch, a large, multinational manufacturing company. Olaf Klemd is Vice President of Connected Industry at Bosch, where he is responsible for coordinating all Industry 4.0 initiatives across the different business units within Bosch.
Dirk Slama: Industry 4.0, Industrial Internet, Internet of Thingsâare these all referring to the same thing?
Olaf Klemd: The Internet of Things and Services (IoTS) is a global megatrend. Whether itâs cars, household appliances, or medical devices, more and more devices are becoming connected via the Internet. Of course, this trend will also affect the way we produce things in the future. Industry 4.0 marks a shift away from serial production in favor of the manufacture of small lots and individualized products. Machines and automation modules will need to be closely interconnected, both with each other and with the required IT systems. It involves linking physical components with associated virtual data in a way that will change the underlying value chainâfrom product design and engineering, to manufacturing and logistics, right through to product recycling. It will also change traditional value chains, transforming them into comprehensive value networks in the industry of the future.
Dirk Slama: What is Boschâs main focus of activity in this area?
Olaf Klemd: Bosch has adopted a dual strategy based on two main pillars. First, Bosch is a leading provider of connected products and services to our customers around the globe. Second, Bosch is a leading plant operator with more than 220 factories worldwide, all of which stand to benefit significantly from these trends.
In terms of connected products and services, we leverage Boschâs vast and well-established product portfolio. We have developed new connected solutions in many Bosch divisions, covering a wide range of applications.
For example, our Drive and Control Technology Division already offers the decentralized, intelligent components required to meet the needs of the future. This is a result of the technological evolution that has been taking place in recent decades. Not without its challenges, the team faced one major obstacle: automation systems and IT systems use completely different programming languages, which makes the exchange of information difficult. They responded to this challenge by developing what we call Open Core Engineering (OCE). This innovative solution is a game changer for the industry, because for the first time it offers a universal translator that allows the exchange of information between IT and machine controls. Machine manufacturers and end users now have the freedom to seamlessly integrate and adapt machines to specific Industry 4.0 solutions by themselves.
Our Packaging Technology (PT) division provides another good example. Its ATMO team has launched the Autonomous Production Assistant. Providing new collaboration opportunities for human/machine interaction in the area of robotics, the Autonomous Production Assistant reduces the overhead for traditional safety mechanisms and dramatically increases flexibility. Another good example is the virtual power plant, developed by our own Bosch Software Innovations division.
As the first to deploy these solutions, Bosch is using its first-mover advantage to build up unique expertise in Industry 4.0 on two fronts. As a leading plant operator, we are actively improving our competitiveness, and by giving open feedback internally, we are improving our products and solutions before they hit the market.
We have identified supply chain management as a critical element of the process. One Industry 4.0 approach is to virtualize the supply chain by using RFID technologies. This not only enables us to make material and product flows more transparent, itâs also an important prerequisite for reducing inventory and ensuring just-in-time delivery. Pilot projects have shown that the use of RFID technologies has helped us to reduce inventory by up to 30%. In 2014, our internal Kanban processes benefited from the integration of data from more than 20 million RFID-driven transactions.
Dirk Slama: What are the key technical drivers of Industry 4.0?
Olaf Klemd: There are many: Big Data, IoT middleware, the increasing trend to use more embedded, integrated systems that allow for the creation of decentralized solutions. However, one very important driver is the proliferation of sensors in the industrial environment. Sensors allow us to capture product, machine, and environment behavior. This data can then be analyzed and correlations derived to help optimize products and processes. Sensors are a key enabler of cyberâphysical systems because they help translate physical events into cyber data.
Dirk Slama: So in terms of timeline, where does this all fit in?
Olaf Klemd: Industry 4.0 is the next logical step in the evolution of automation. We started some years back with connected manufacturing, so it is still an ongoing process really. The German governmentâs Industry 4.0 initiative was helpful in focusing our efforts, encouraging us to set up more than 50 initial pilot projects in 2013. At the time, it was very much a bottom-up effort. Today, we take a more holistic approach to ensuring that these trends are leveraged across our entire internal value chain and international production network.
Dirk Slama: What does this mean for people working in Bosch factories?
Olaf Klemd: Our main goals include the creation of sustainable workplaces and a good work environment. From the companyâs viewpoint, sustainable workplaces depend on product innovation and process efficiency. From the viewpoint of workers, the continuous development of new skills through the use of new technologies is also important. Ultimately, Industry 4.0 is more than just a tool for improving efficiencyâit is an important driver for improving the work environment in general. For example, new humanâmachine interfaces represent a significant improvement for the work environment. The reduction of heavy, monotonous labor is a good example of how physical work can be supported effectively. In terms of collaborative work, the availability of more reliable, real-time data is generally welcomed as it helps people to make better decisions and be more successful in their work. In keeping with our own strategic imperative, âInvented for Life,â we believe that Industry 4.0 will provide significant contributions in this area.
Industrial Internet Consortium
Another noteworthy organization promoting the adoption of Industrial Internetârelated topics is the Industrial Internet Consortium. GE, which coined the term âIndustrial Internet,â initiated the creation of the Industrial Internet Consortium in 2014, with AT&T, Cisco, Intel, and IBM joining as founding members. While initially driven by US-headquartered companies, the Industrial Internet Consortium takes a global take on the Industrial Internet, with more than 100 new members from many different countries joining the Industrial Internet Consortium in its first year.
The Industrial Internet Consortium takes a relatively broad perspective on the Industrial Internet: in addition to manufacturing, the Industrial Internet Consortium also looks at energy, healthcare, public sector, and transportation. The Industrial Internet Consortium sees itself more as an incubator for innovation. Its Working Groups address the architecture and security requirements for the Industrial Internet, but the Industrial Internet Consortium itself is not a standardization body.
An important tool to drive the adoption of new technologies and business models in the Industrial Internet is the so-called testbed. A testbed is a member-sponsored innovation project that supports the general goals and vision of the Industrial Internet Consortium and is compliant to the Industrial Internet Consortium reference architecture. An example for an Industrial Internet Consortium testbed is the Track & Trace Solution, which is described in detail in Part III of the book. This Industrial Internet Consortium testbed is utilizing the Ignite | IoT methodology for solution delivery.
Case Studies: Overview
The remainder of this chapter provides a number of case studies to illustrate some of the different facets of the Industrial IoT. We are always on the lookout for additional case studies, so if you feel you have something to offer in this space, contact us via our website:
- SmartFactoryKL
This case study is an industrial-grade research project that showcases key elements of the smart factory, including decoupling of production modules and product memory.
- Tracking of mobile equipment
-
This subject includes two case studies:
- Intelligent lot handling
This case study describes the use of high-precision indoor localization technology to optimize wafer production.
- Cleaning equipment
This case study looks at fleet management for mobile cleaning equipment and an innovative management dashboard.
- Cool chain management
This case study goes beyond traditional container tracking and looks at actively managing the environment inside the container.
- Nuclear particle physics
This case study looks at one of the largest pieces of industrial machinery built by mankind and its extremely advanced use of sensors.
Part III of this book provides a further Industrial IoT case study on the Trace & Trace solution for handheld power tools.
Case Study: Smart Factory
The increasing flexibility of production processes, associated customization requirements, and the push for âbatch size 1â production are key drivers of the concepts of the smart factory and Industry 4.0. A leading research organization in this space is SmartFactoryKL, a special interest group specialized in the practical validation of theoretical manufacturing concepts. In collaboration with industry partners, SmartFactoryKL develops and tests industrial systems in realistic industrial production environments. This case study relates to the Industry 4.0 demonstration system that was showcased at the Hannover Messe industrial technology fair in 2014 [DF1].
The Industry 4.0 demonstration platform is a production line that allows the automatic assembly of customized business card holders from various components, the engraving of business names via laser, and the automatic completion of basic test functions. Bosch Rexroth and Harting modules are used for assembly, a Festo module is used for the engraving, and a PhoenixContact module is used for laser writing. Quality assurance is provided by a module developed by Lapp Kabel. MiniTec has provided a manual workstation with integrated augmented-reality guidance features. Figure 4-4 shows the assembly line, as demonstrated in Hannover in 2014.
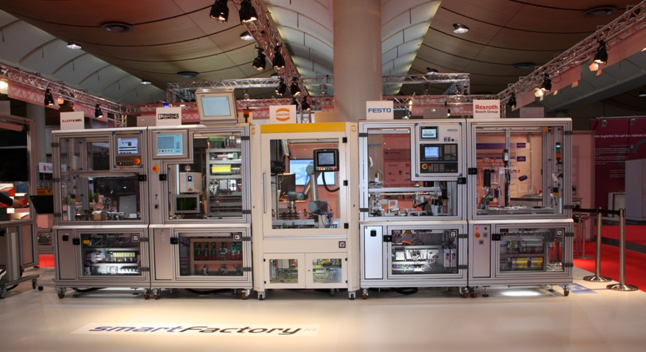
Figure 4-4. Industry 4.0 assembly line (Source: SmartFactoryKL)
What makes the assembly line so special is that it can be reassembled dynamically thanks to its modular structure. As demonstrated in Hannover, the sequence of the production modules can be changed in a matter of minutes. All production modules are fully autonomous; there is no central MES or other production control system involved. This is achieved using digital product memory, which stores product configurations as well as the corresponding work instructions and work history.
The Festo module is responsible for starting the production process. This is where the base casing of the business card holder is unloaded and customer-specific data is engraved onto an RFID tag, which is then attached to the base plate. The module then engraves the base of the holder itself as per customer specifications. Next, the Rexroth module mounts the clip to the base casing of the business card holder. Depending on the customerâs specifications, the Harting module then places either a blue or black cover onto the base plate and force fits the two components together. The PhoenixContact module then takes over, using a laser system to add an individual QR code and lettering to the product.
The last module in the assembly line is the LappKabel module, which performs a quality check and releases the final product. Other partners such as Cisco, Hirschmann, ProAlpha, and Siemens have also contributed their expertise to the project. This has allowed the integration of different IT systems and the creation of a backbone structure to feed the individual modules of the assembly line. The key elements of the assembly line are shown in Figure 4-5.
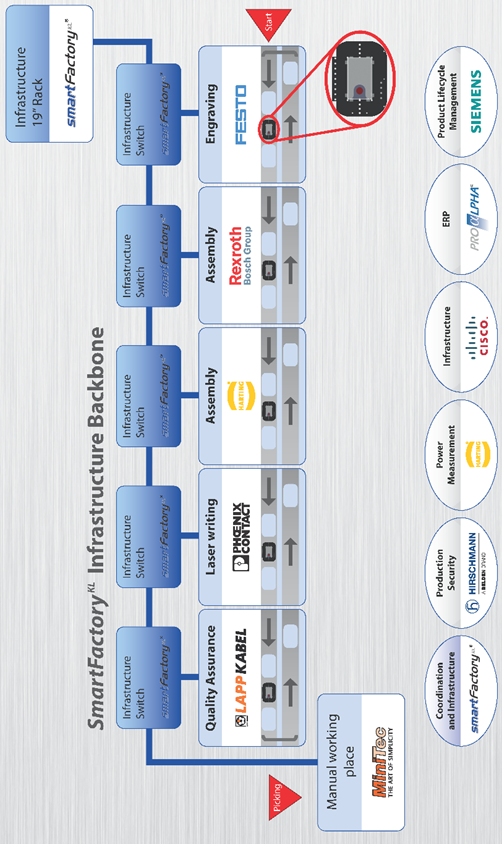
Figure 4-5. Architecture of the Industry 4.0 demonstrator (Source: SmartFactoryKL)
A key objective of the Industry 4.0 demonstration platform was to show how standardized production modules can be easily integrated and exchanged. Project initiator and chairman of the SmartFactoryKL board, Prof. Dr. Dr. h.c. Detlef Zühlke explains:
To ensure the modularity of production systems, the mechanical, electrical, and communication interfaces need to follow standards. Useful standards can only emerge on the basis of actual requirements and experience. This means that standards have to develop simultaneously with the adoption of Industry 4.0. Already there are a number of standards available at different levels, and we should use these standards. We do not need to start from scratch. Itâs only at higher interoperability levels that a lot more work still needs to be done.
For the Industry 4.0 demonstration platform, standardization was achieved at a number of levels:
- Digital product memory
Digital product memory is integrated into the various workpieces using RFID technology. Data is exchanged between the workpieces and the production modules based on a standardized cross-manufacturer.
- Vertical integration
Production modules and business applications are integrated based on the OPC UA standard.
- Transportation of workpieces
An innovative sluice system was devised to facilitate the interconnection of production modules and the standardized conveyor belts within them.
- Assembly line topology
Automatic neighborhood detection for independent topology derivation.
- Production modules
Asset Integration Architecture
Figure 4-6 provides more details of the solutionâs individual components. Each product has an RFID tag that can be read and written to and from a remote device (a). The tag stores product configuration data and the work history. Each production module has an integrated RFID unit that accesses this data from the product in order to read work instructions and create new entries in the work history (b). The ERP system creates the work definition for the product using the Festo moduleâs RFID unit.
The use of product memory and a standardized data exchange format to control the production process across multiple production modules is very interesting, because it simplifies integration. Instead of having to integrate all modules into one complex central system, the interfaces are loosely coupled and relatively simple. The product controls its own flow and the work that has to be done in this flow. Especially in cases where products are worked on in multiple organizations, this has the potential to greatly simplify integration and provide for much greater flexibility.
The modules in the demonstration platform have different architectures. Some follow a more traditional approach; for example, module A has a PLC for controlling the pick-and-place units, and uses an OPC UA server to provide access to the business logic in the backend.
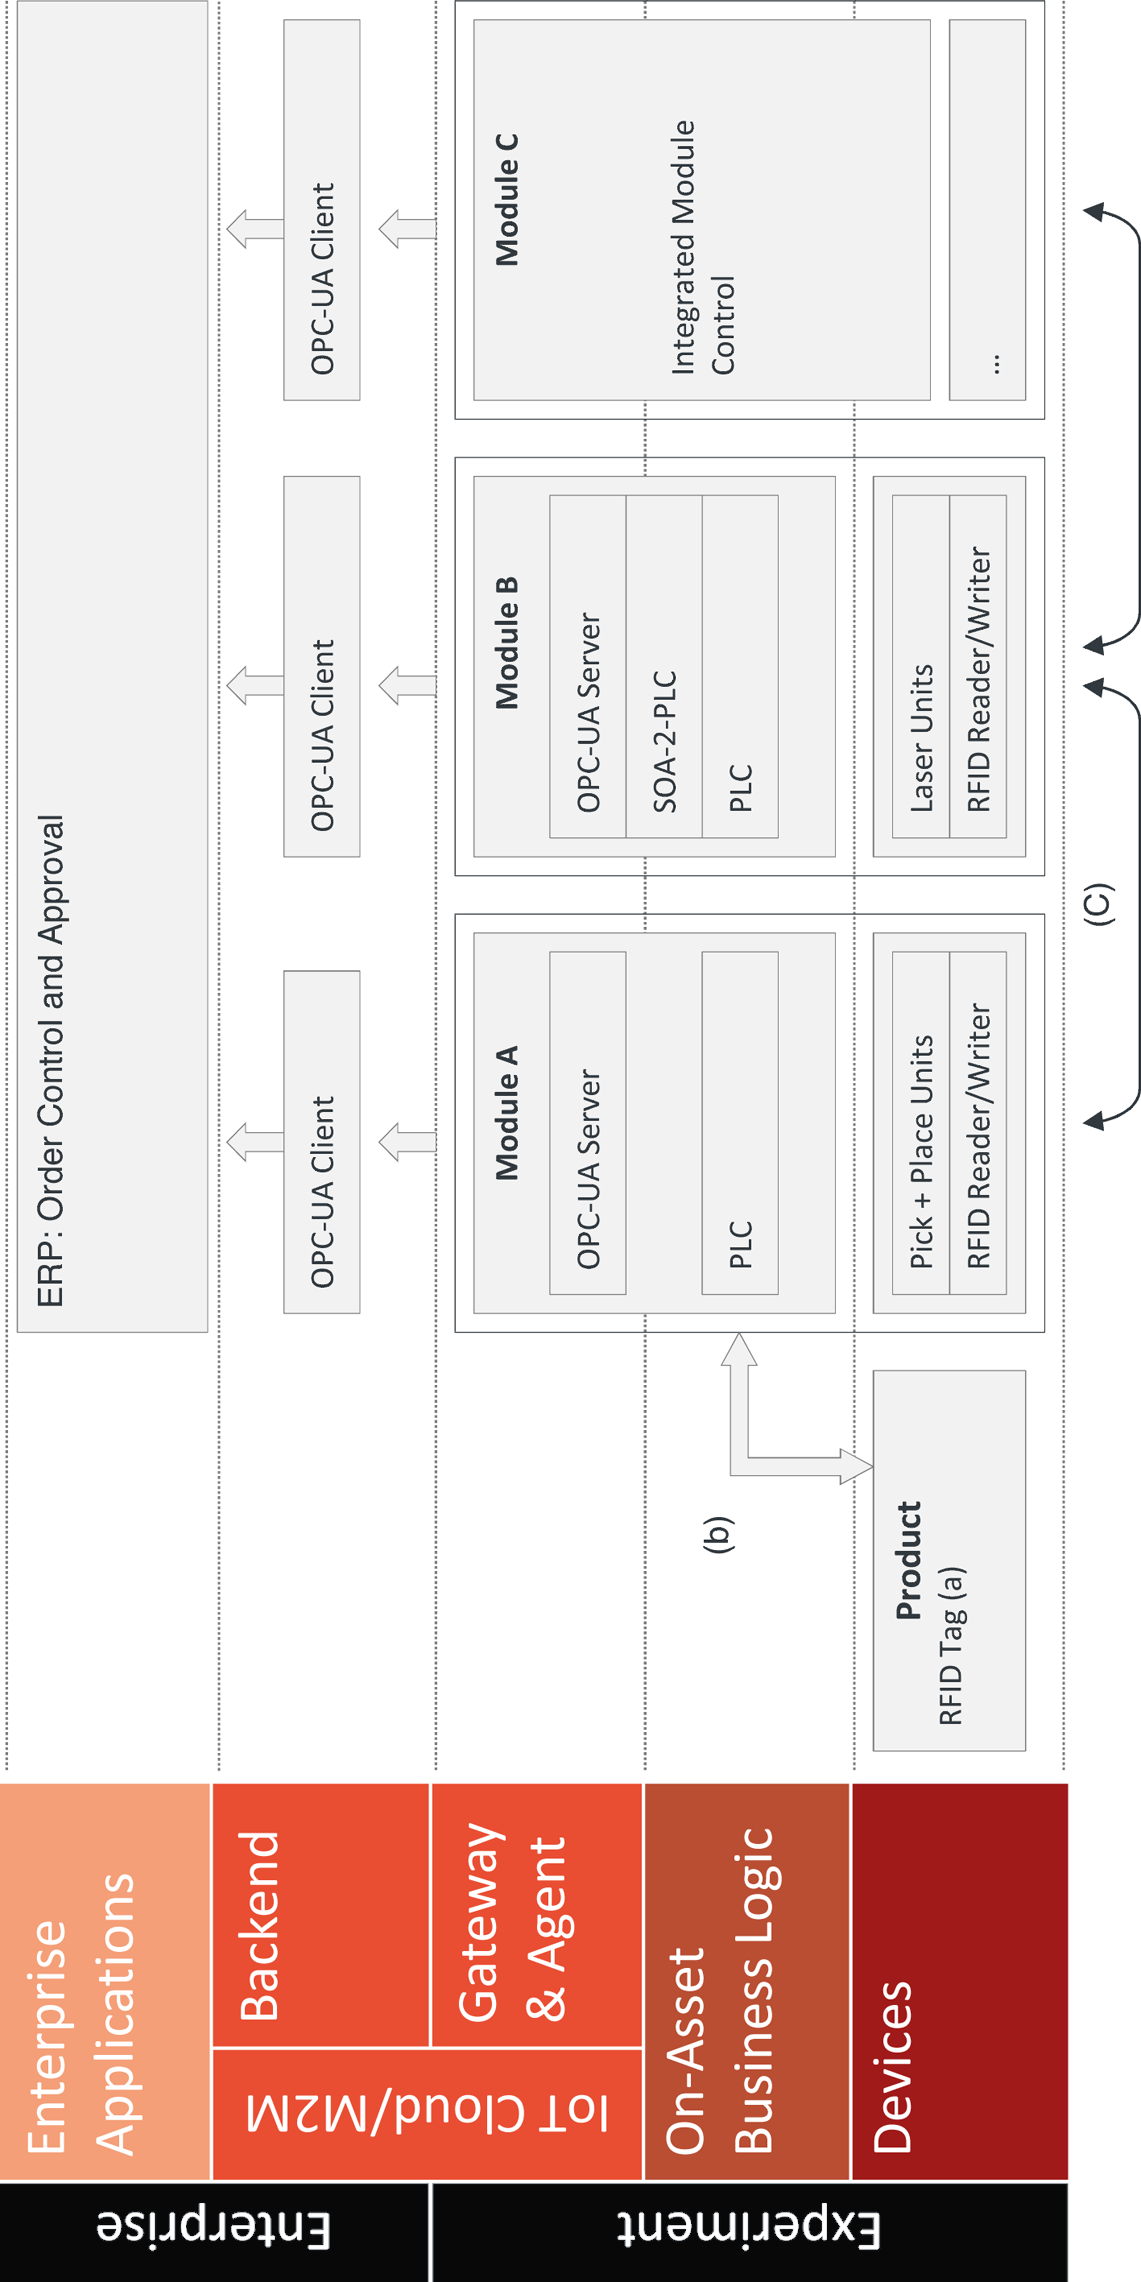
Figure 4-6. AIA for SmartFactoryKL demonstrator
Module B reads the customer name and address from the productâs RFID tag and then uses this data to create a customer vCard, which is lasered onto the business card holder in the form of a QR code. Again, the laser is controlled from a standard PLC. It is also planned to use SOA-2-PLC for backend integration.
In the future, Module C will also be a little bit different from the other modules in that it will use a small but powerful Linux-based microcontroller to create a single, integrated network of actuators/sensors (e.g., pneumatic press) with their own intelligence.
The physical coupling of the modules is based on a standardized hatch through which the products are moved (c). This hatch allows conveyer belts within the modules to move the product from module to module.
The central functionality provided by the backbone is the supply of power, pressured air, industrial Ethernet, and an emergency stop function. There is no central SCADA or similar system involved. This means that production modules can be used as individual plug-and-play units, and their sequence changed in a matter of minutes.
Conclusions and Outlook
Thanks to the integration of product memory, the SmartFactoryKL demonstration platform has shown that important Industry 4.0 concepts such as single-item flow and loose coupling of production modules can be implemented using technology that is already available today. The SmartFactoryKL consortium plans to build on the concepts demonstrated in the system, and to add additional modules from new partners. The production process used for the demonstration will be extended and its capabilities enhanced on an ongoing basis. The first update is set to be unveiled at Hannover in April 2015.
The industry partners involved in the project are keen to transfer these concepts from a research environment to live production environments. However, this is unlikely to happen any time soon. According to Prof. Zühlke, there is more work to be done:
In some areas, like in semiconductor production, we have made considerable advances in establishing module standards. However, I think it will be at least another three years before we start seeing initial implementations of the Smart Factory in a live production environment. In terms of full implementation, I think we are talking 10 years or even more.
However, Prof. Zühlke is keen to stress that companies should not miss the boat:
Some companies are already under pressure to keep up with ongoing developments. Industry 4.0 is not just a minor trend; these concepts and technologies represent a fundamental paradigm shift that will completely transform the manufacturing landscape as we know it today.
Case Study: Intelligent Lot Tracking
Modern semiconductor chip factories are among the most advanced production facilities in existence today. The cost of building a next-generation chip factory can easily exceed $1 billion. 24/7 production involving hundreds of employees in large clean-room facilities yields billions of chips per year. The semiconductor production process is extremely complex. Typically, multiple circuits are grouped on a single wafer, which undergoes complex chemical processes in a clean-room environment to build up the circuits in layers. Several wafers are then placed in a wafer carrier for processing. These wafer carriers hold the wafers between the processing stages. Advanced wafer carriers such as a state-of-the-art FOUP (Front Opening Unified Pod) can be used to automatically unload the wafers in the next production bay and reload them again after processing. Up to 500 production steps per wafer may be required, using hundreds of different machines. Some of the larger semiconductor factories have full-scale material handling systems that automatically move wafer carriers between production bays. In many factories which require more flexibility and support for a broad product mix, wafer carriers still need to be transported between production bays manually.
Figure 4-7 shows an example of an FOUP wafer carrier (sometimes called a âlot boxâ) and its path through a factory, also known as a âwafer fab.â
In wafer factories that donât have an automated material handling system, the production process is generally managed on the basis of dispatch lists. The dispatch list defines the order in which the production lots have to be processed. One of the main problems here relates to the localization of individual wafer carriers, as many factories use thousands of these carriers. Manual processing is costly and prone to error.
This is where intelligent lot-handling solutions come in. These use indoor localization technology to automatically track the position of each wafer carrier in a production facility. Positioning data is managed in a central database, which is closely integrated with the manufacturing execution system (MES).
Signaling devices, such as LEDs or markers (which change colors from black to yellow), indicate whether a wafer carrier is currently scheduled for further processing. A display panel on the wafer carrier shows additional processing information, such as the lot number, next production operation, or next destination of a lot box. However, implementing this kind of solution presents multiple challenges, as we will soon see.
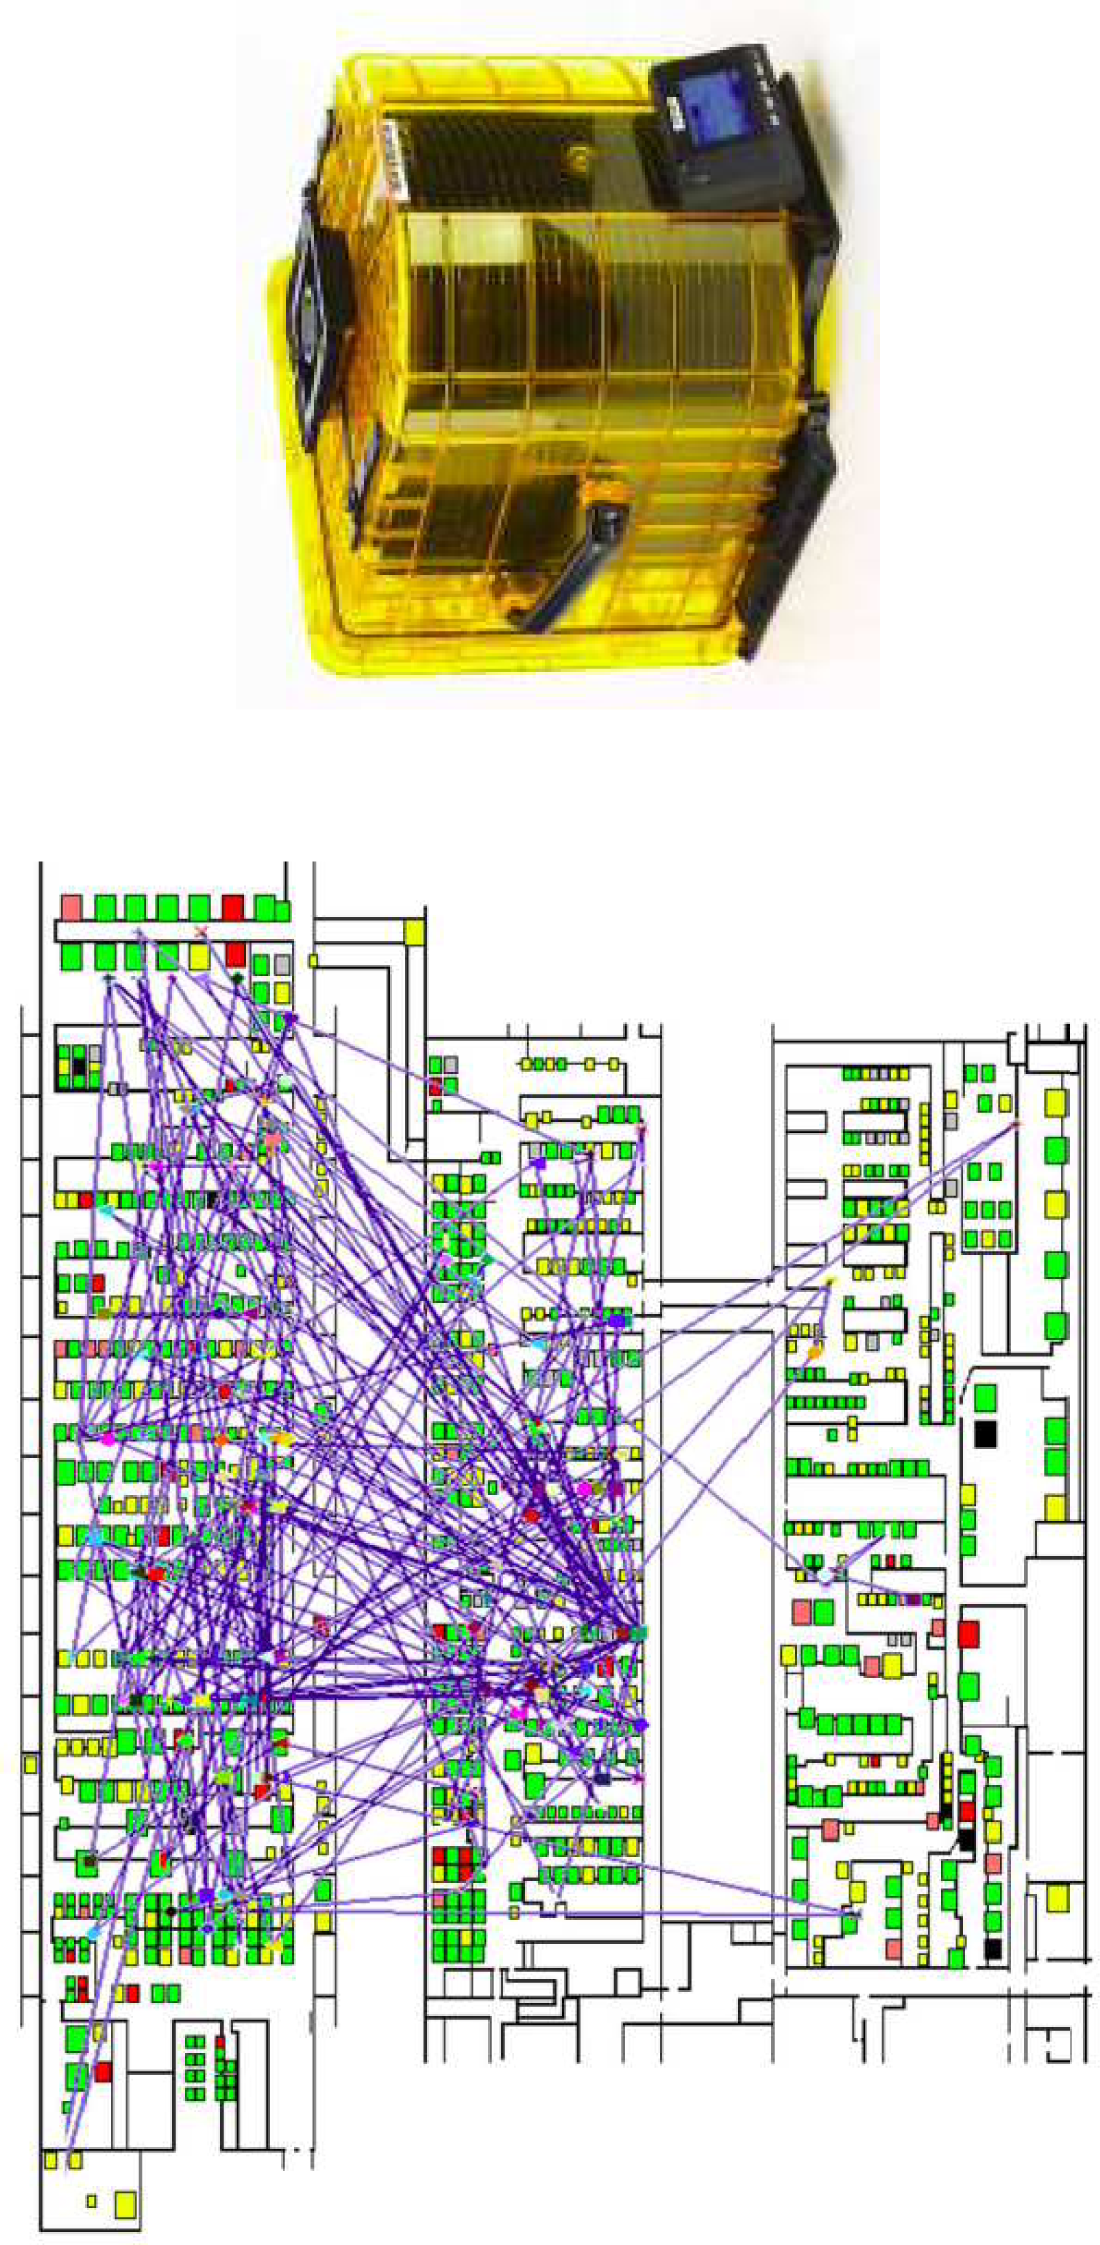
Figure 4-7. Logistical challenge: path of a lot box through a fab (Source: Infineon Technologies AG)
A good example of an intelligent lot-tracking solution is LotTrack, developed by Swiss company Intellion, which we will examine in more detail in this case study. LotTrack is a system designed to improve the overall workflow in manually operated wafer fabs. It consists of three key components:
- DisTag
A smart device placed on each wafer carrier, which enables wafer carriers to be located within the factory to an accuracy of approximately 0.5 meters. The DisTag also has a control panel for local interaction with the factory operators. Signaling devices like an LED and a marker provide priority and search functions. Battery lifetime is approximately two years.
- Antenna lines
The modular antenna line contains all the hardware modules required for indoor localization, assistance, and load port compliance. It is usually mounted to the ceiling of the clean room along the factoryâs interbay and intrabay.
- Control suite
The backend software is the link between shop-floor activities and the MES. It provides a dashboard for visualizing all transport and storage activities.
Customers like Infineon, STMicroelectronics, and OSRAM use the LotTrack solution to reduce cycle times and work-in-progress (WIP), increase operator efficiency, digitize and automate paper-based administration processes, and enable automatic authentication of production lots at the equipment.
Technical Architecture
The Infineon plant in Villach, Austria, is the headquarters of Infineonâs Automotive and Industrial Business Group, which mainly develops integrated circuits (ICs) for use in cars, such as engine control ICs. Flexibility is important for this factory, which produces approximately 800 different products with a total volume of 10 billion chips per year [LT1]. Because of the high number of different products and associated production process variations, the factory uses a manual transportation process for wafer carriers. Over 1,000 wafer carriers have to be managed simultaneously. In storage areas, over 16 wafer carriers can be stored per square meter. The clean room contains numerous elements that can cause electromagnetic reflection, such as the walls, production equipment, and storage racks.
These factors all make this kind of factory a highly challenging environment for a tracking solution. In particular, finding a technical solution for indoor localization that combines an acceptable cost factor with sufficiently high resolution is still a challenge (see section on indoor localization systems in âWireless Indoor Localizationâ). To address this problem, the LotTrack solution uses active and passive radio-frequency identification (RFID) in combination with ultrasound technology (Figure 4-8). The antennas on the ceiling contain ultrasound emitters that periodically send out a ping signal. These ping signals are received by the DisTags on the wafer carriers. The DisTags compute the outward travel time of the ultrasound waves and temporarily store the results locally, together with the signal strengths. Using RFID communication, the ping signal analysis data is communicated back to the RFID receivers in the antenna lines. From here, this data is sent back to the central server. In the backend, a complex algorithm derives the real-time position information from the UHF (Ultra-High Frequency) pings sent from the antennas to the DisTags [LT1].
The system in place at Infineon Austria now processes three billion UHF pings per day! From this, around 270 million positions are calculated, to an accuracy of approximately 30 centimeters. About 500,000 position updates are communicated to the client systems each day. The system operates in near real time, with the result that position changes by wafer carriers are recognized by the backend system within 30 seconds [LT1].
Conclusions and Outlook
These are the key lessons learned from Intellion:
Wafer factories with a diverse product portfolio are particularly in need of solutions that are more flexible than fully automated conveyor belts. Intelligent lot handling can provide the required flexibility if delivered as a modular system.
These types of environments have very strict requirements. Ensuring 100% availability calls for significant investment and a sound infrastructure design.
High precision for indoor localization depends on a combination of technologies (in this case, ultrasound and RFID). This is especially feasible in wafer fabs due to fab setup (i.e., long floors with straight branches between them).
The need for maximum efficiency in system management should not be underestimated.
Customers require long-term support, which means that the solution design and roadmap must be capable of dealing with multiple system versions in the field. The challenge facing product management teams is to efficiently manage advances in new technology and product versions. Downward compatibility becomes a major concern.
We would like to thank Kai Millarg, Managing Partner at Intellion, for his support in writing this case study.
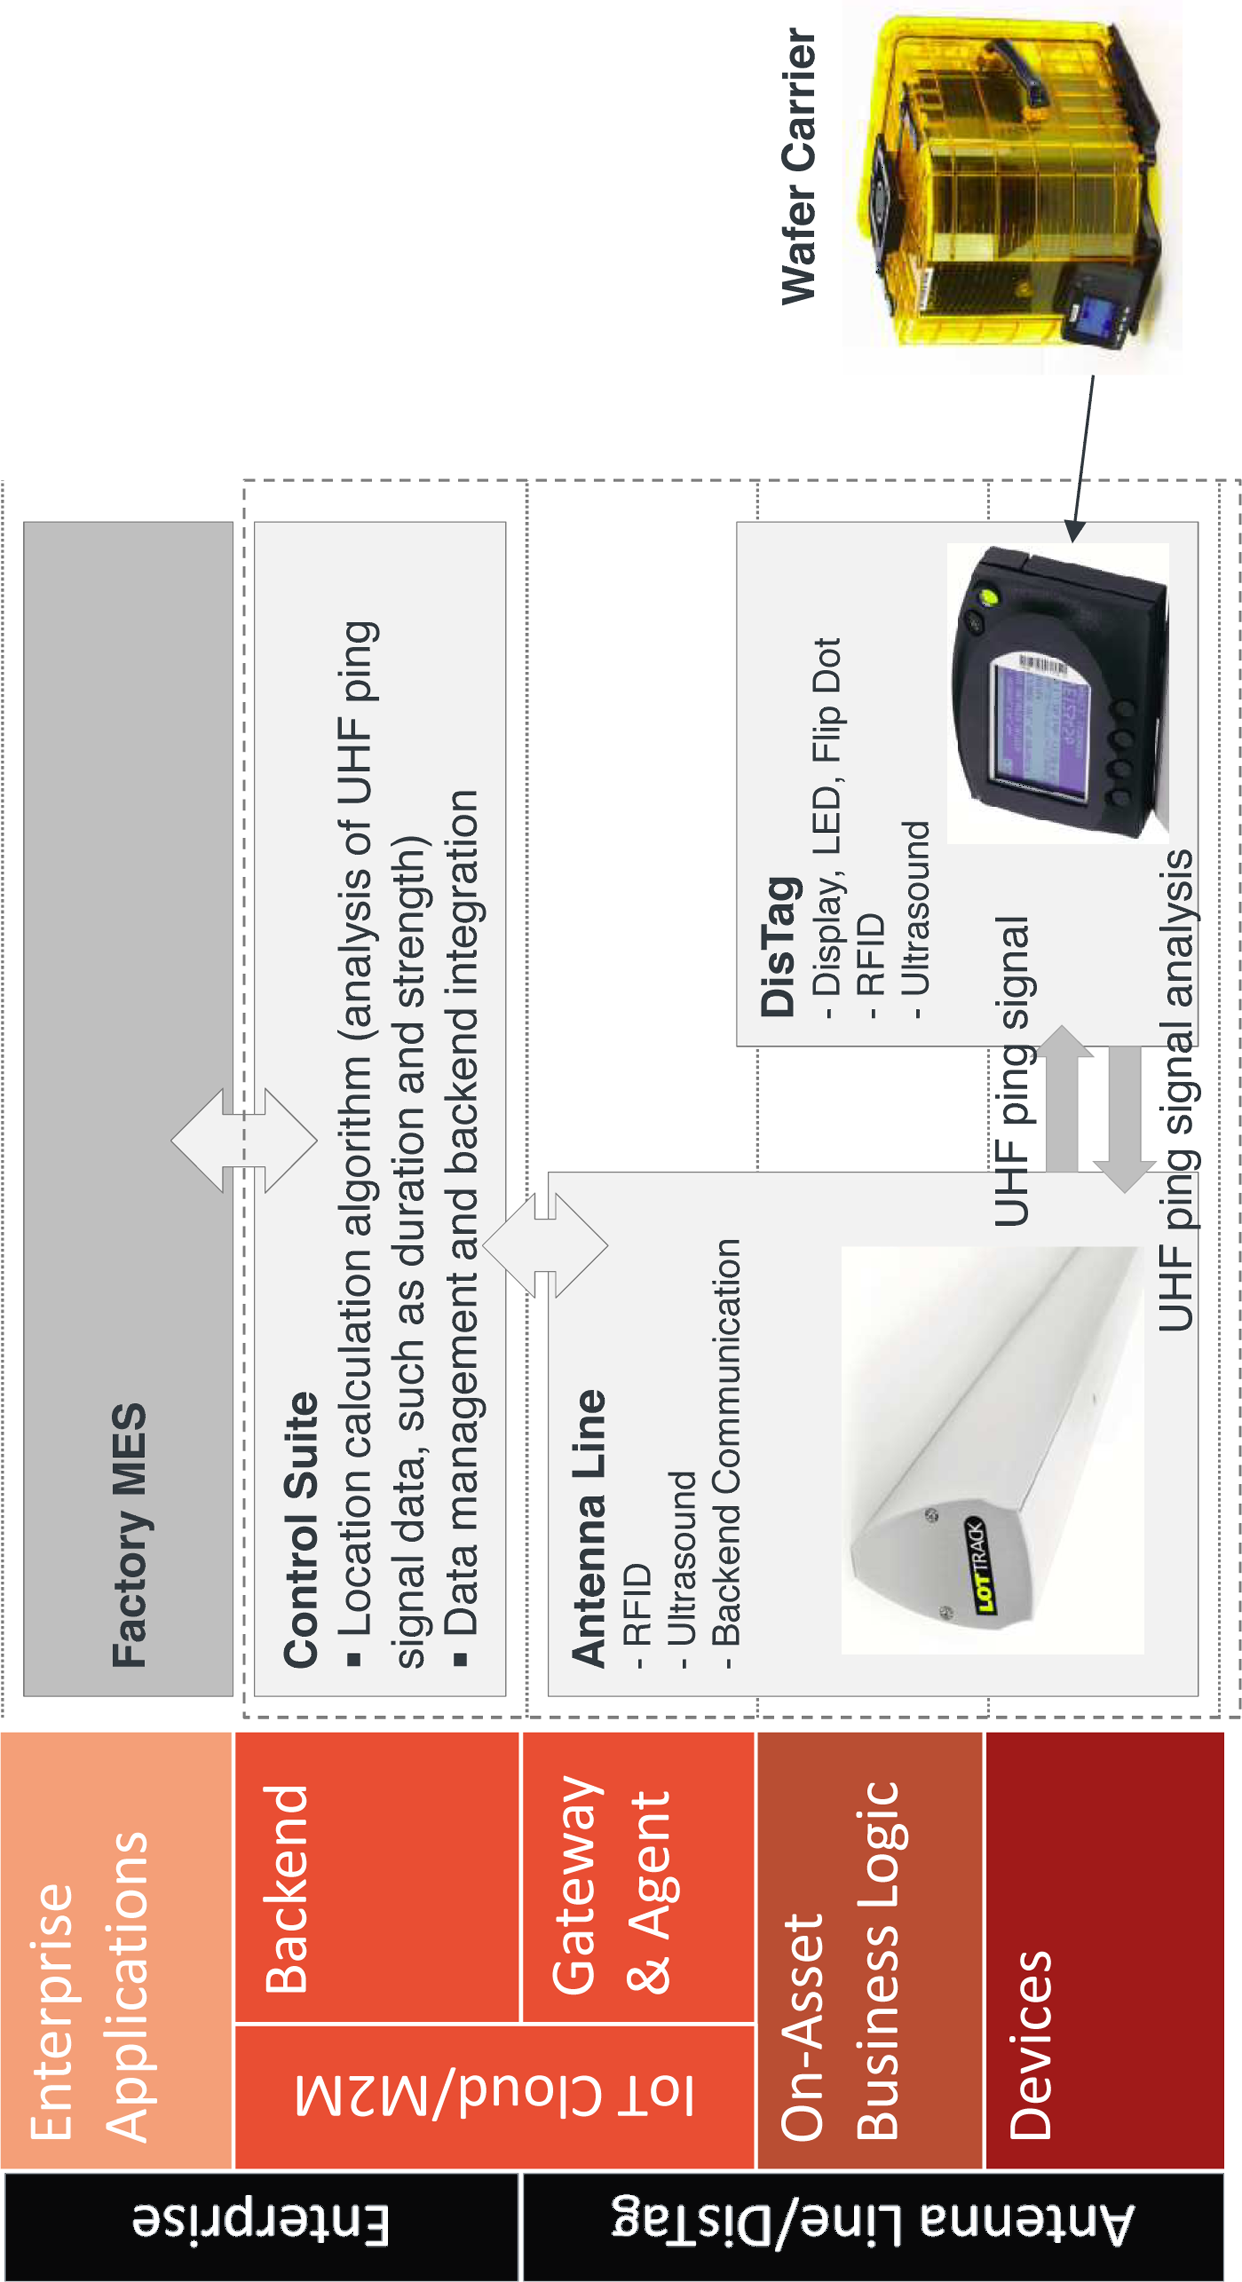
Figure 4-8. AIA for intelligent lot tracking
Case Study: Cleaning Service Industry and Technology
The global cleaning service industry is a huge and growing market. According to Frost and Sullivan, revenues in North America alone will reach USD 14 billion in 2015 [FS09]. The cleaning service industry is highly competitive. A small number of multinational companies account for a large share of the market, complemented by smallânot only specializedâoperators. Demand is mainly driven by building service contractors, commercial offices, hospitals, hotels, and industrial facilities. Among all facility maintenance services, janitorial services are the most commonly outsourced services. Main competitive factors include cost savings, strong customer relationships, geographic reach, service quality, experience, and reputation. In order to meet customersâ cost expectations, large cleaning service providers constantly push for technological innovations.
This demand is addressed by companies such as Kärcher, the world market leader in cleaning technology with more than 11,000 employees and more than 12 million machines sold in 2014. The Kärcher product portfolio mainly includes high-pressure cleaners, vacuums, scrubber driers, sweepers, water dispensers, municipal equipment, vehicle cleaning systems, industrial cleaning systems, detergents, and several complimentary service contracts and services, such as software and consulting
Modern cleaning machines are powerful technologies, and facility management and cleaning service providers rely on large fleets of these types of tools to meet their efficiency and cost targets. For example, a banking customer with 3,000 branches recently awarded a cleaning contract to a large facility management company. The facility management company requires about 6,000 advanced cleaning machines to service this contract. The contract is renewed on a yearly basis. The facility management company will often try to pass some of its own risk on to the equipment provider by negotiating contract conditions that would require the equipment provider to take back its machines if the end customer contract is canceled. So it is in both companiesâ best interests to manage such a fleet of 6,000 machines as efficiently as possible.
These types of scenarios are the reason why Kärcher decided to develop a fleet management solution for cleaning machines that uses wireless connectivity to manage the equipment and provide fleet managers with a centralized, near real-time view of the fleet status, and provide additional functionalities like equipment utilization optimization and preventive maintenance.
Kärcher Fleet Management Solution
Figure 4-9 uses the Ignite | IoT Solution Sketch template to illustrate the key elements of the Kärcher Fleet Management solution. The solution manages many different kinds of cleaning machines, from larger cleaning machines such as big scrubber driers to smaller vacuums, used in industries such as facility management, healthcare, retail, and others.
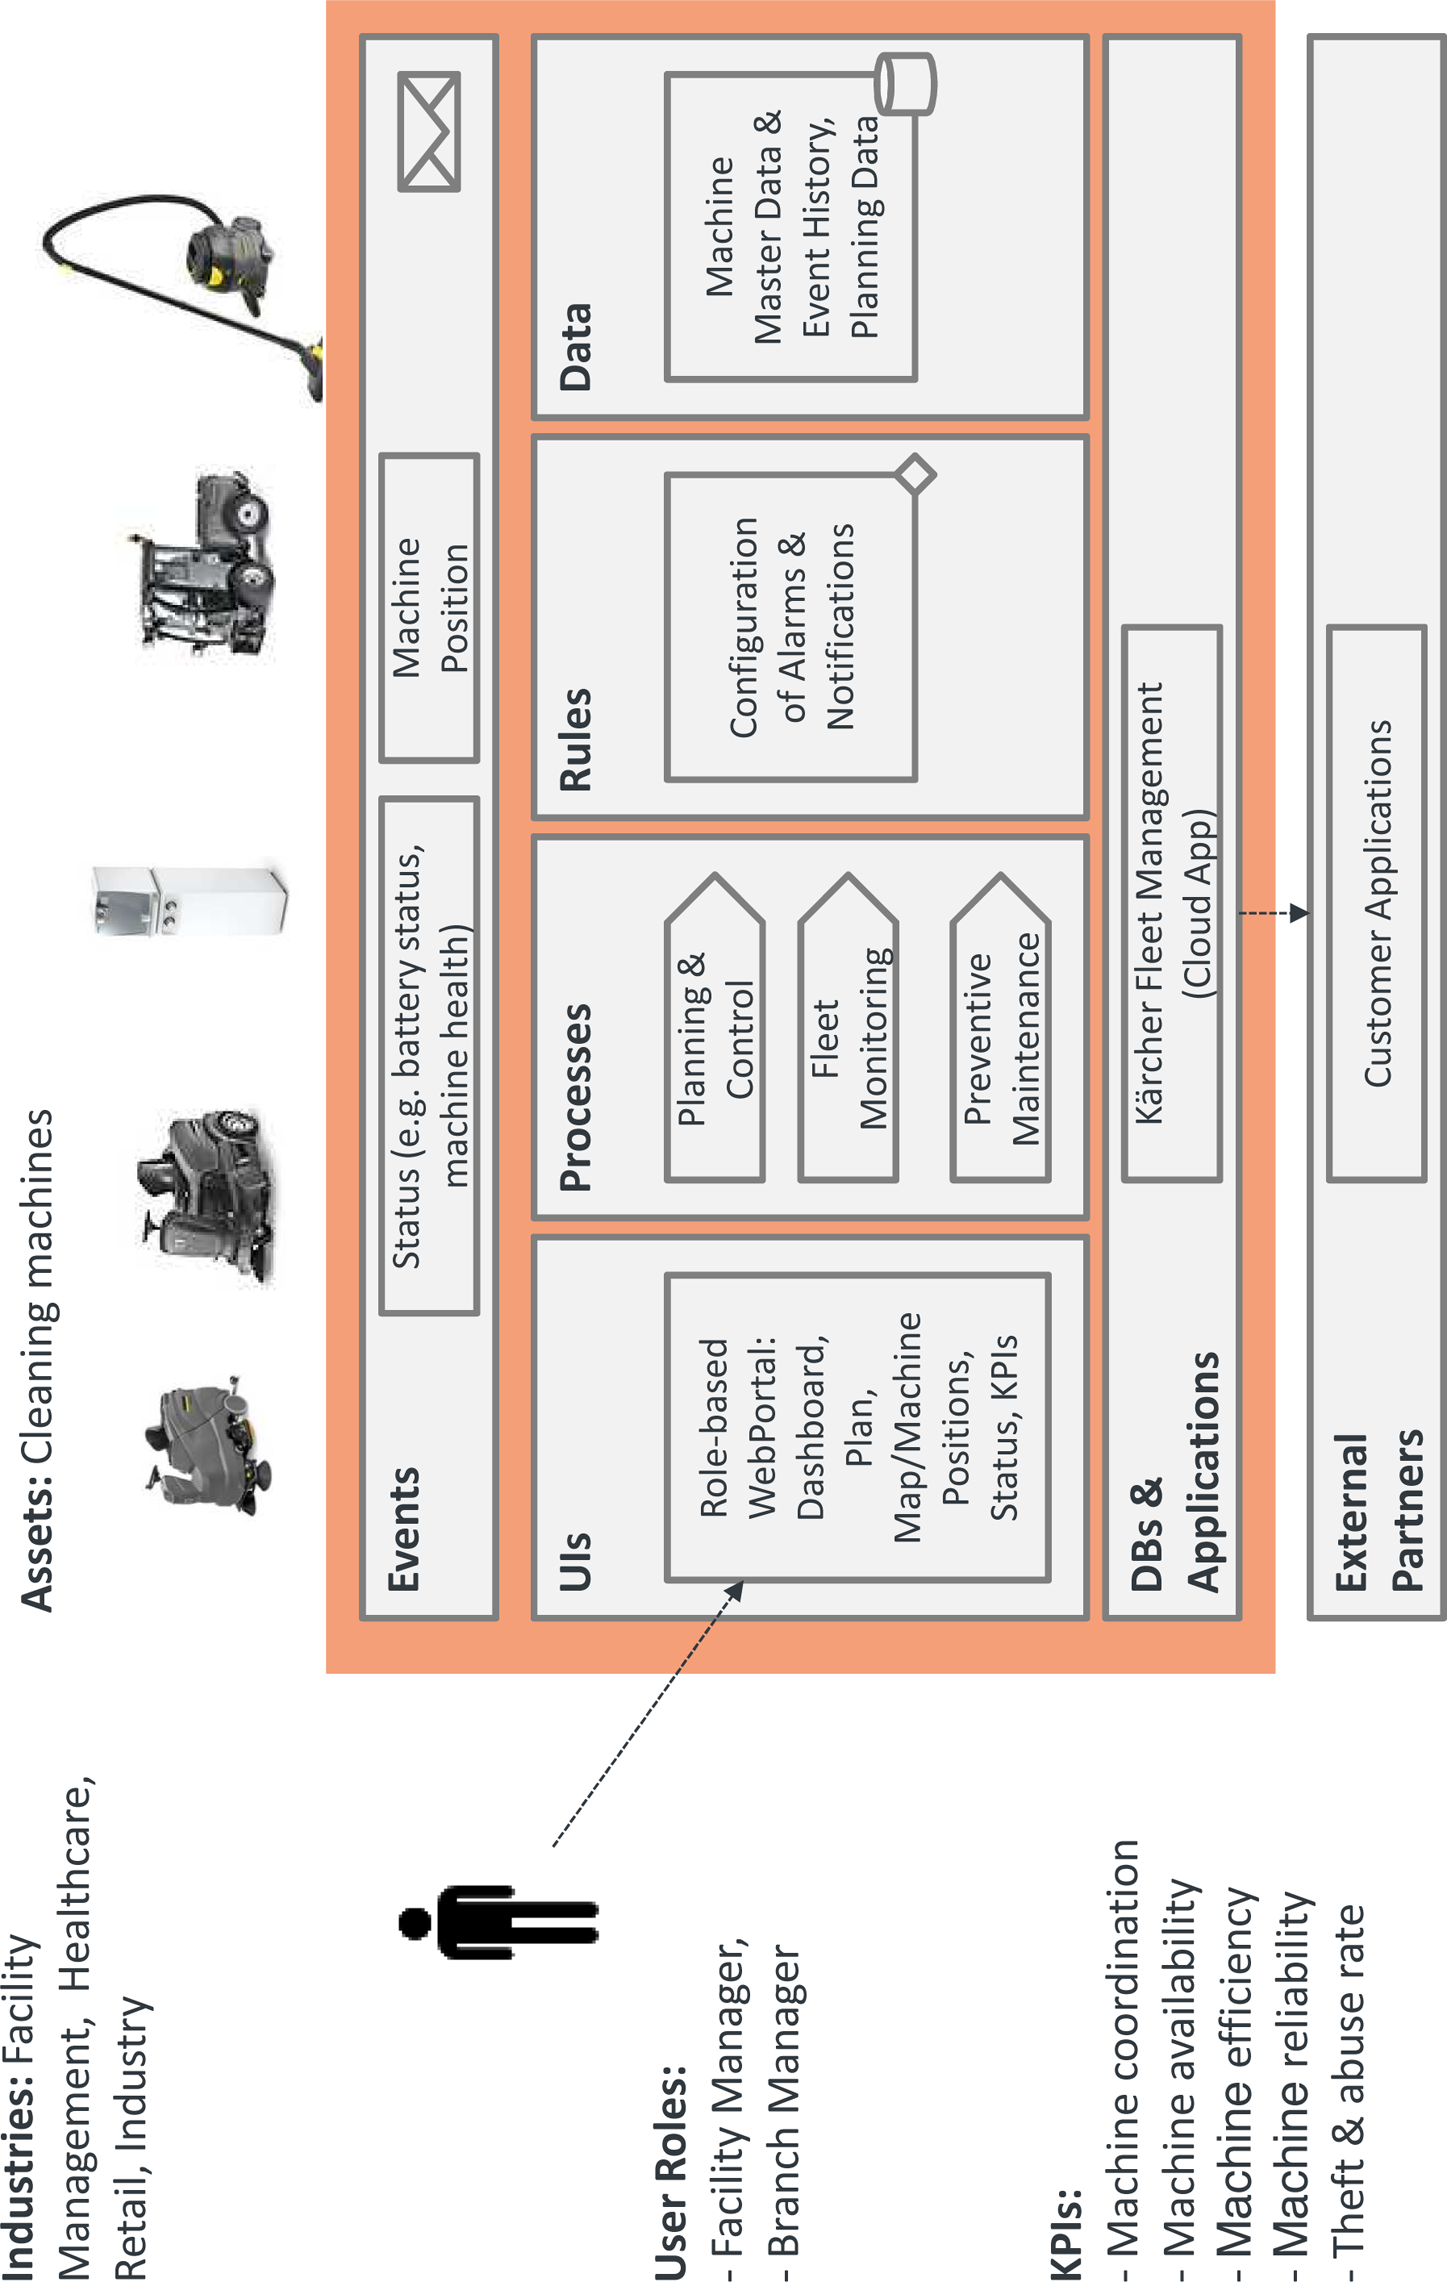
Figure 4-9. Ignite | IoT Solution Sketch for Kärcher Fleet Management
The solution supports processes such as planning and controlling, fleet monitoring, and preventive maintenance. Key user groups are facility managers and branch managers of the respective facility management company. The solution provides role-specific views for facility managers, branch managers, and others. The role-based web portal includes a dashboard, a machine planning perspective, a visual mapping of machine positions to locations, and detailed views for machine status and KPIs such as machine availability, machine efficiency, cleaning reliability, and theft and abuse rate. The solution can receive and process different types of events from the machines, including machine status and machine position. Business rules allow for flexible customization of alarms and notifications. The Kärcher Fleet Management solution is delivered as a multitenant-capable cloud solution. Customers can integrate the solution with their own in-house ERP and other applications.
Portal
A key feature of the solution is the role-based web portal. A screenshot of the main dashboard is shown in Figure 4-10. The fleet overview widget provides a high-level overview over the whole fleet utilization as a pie chart. The notification widget shows the most high-priority notifications, such as machine errors, violations of machine usage schedules, or use in invalid geo locations. The machine status overview widget shows only the status of those machines that are currently requiring attention. The machine location widget shows the location of the machines that require attention. The performance and utilization widget provides an overview of machine health, scheduled start reliability (last full week), machines assigned to facilities (are machines in use or still in the warehouse?), and deployment ratio (are machines where they are supposed to be?).
A full report can be exported, which includes machine utilization details, planned hours, deviations, and other information. Machine status can be viewed in full detail, including status, battery charging levels, battery health, machine location and last known address, as well as data timeliness.
One interesting lesson learned from the dashboard design was the machine status widget. The internal sales team naturally wanted to focus on âwhat is actually working.â In the customer design workshops, it became clear that the customer assumes that most of the machines are working, and that he only wants to see the âmachines requiring attention.â This was important input for the design of this widget.
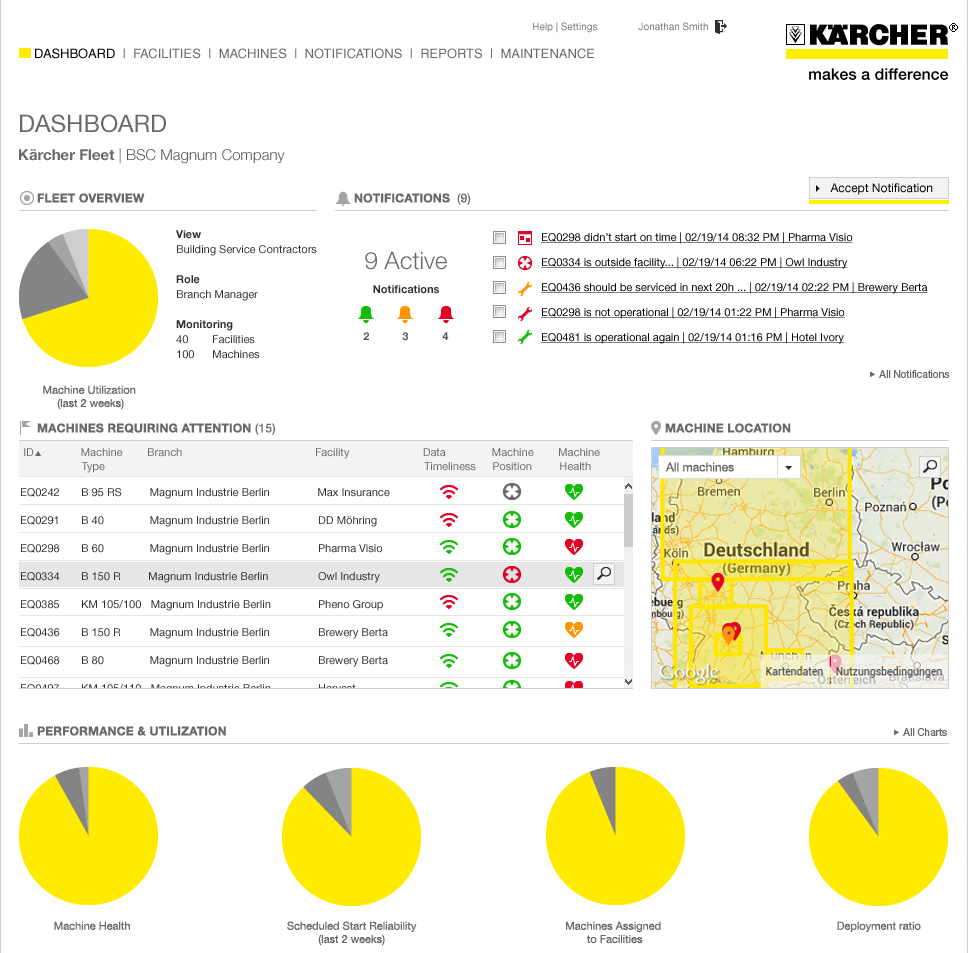
Figure 4-10. Main dashboard of Kärcher Fleet Management (Source: Kärcher)
Asset Integration Architecture
Figure 4-11 uses the Ignite Asset Integration Architecture (AIA) template to provide an overview of the main technical components of the fleet management solution.
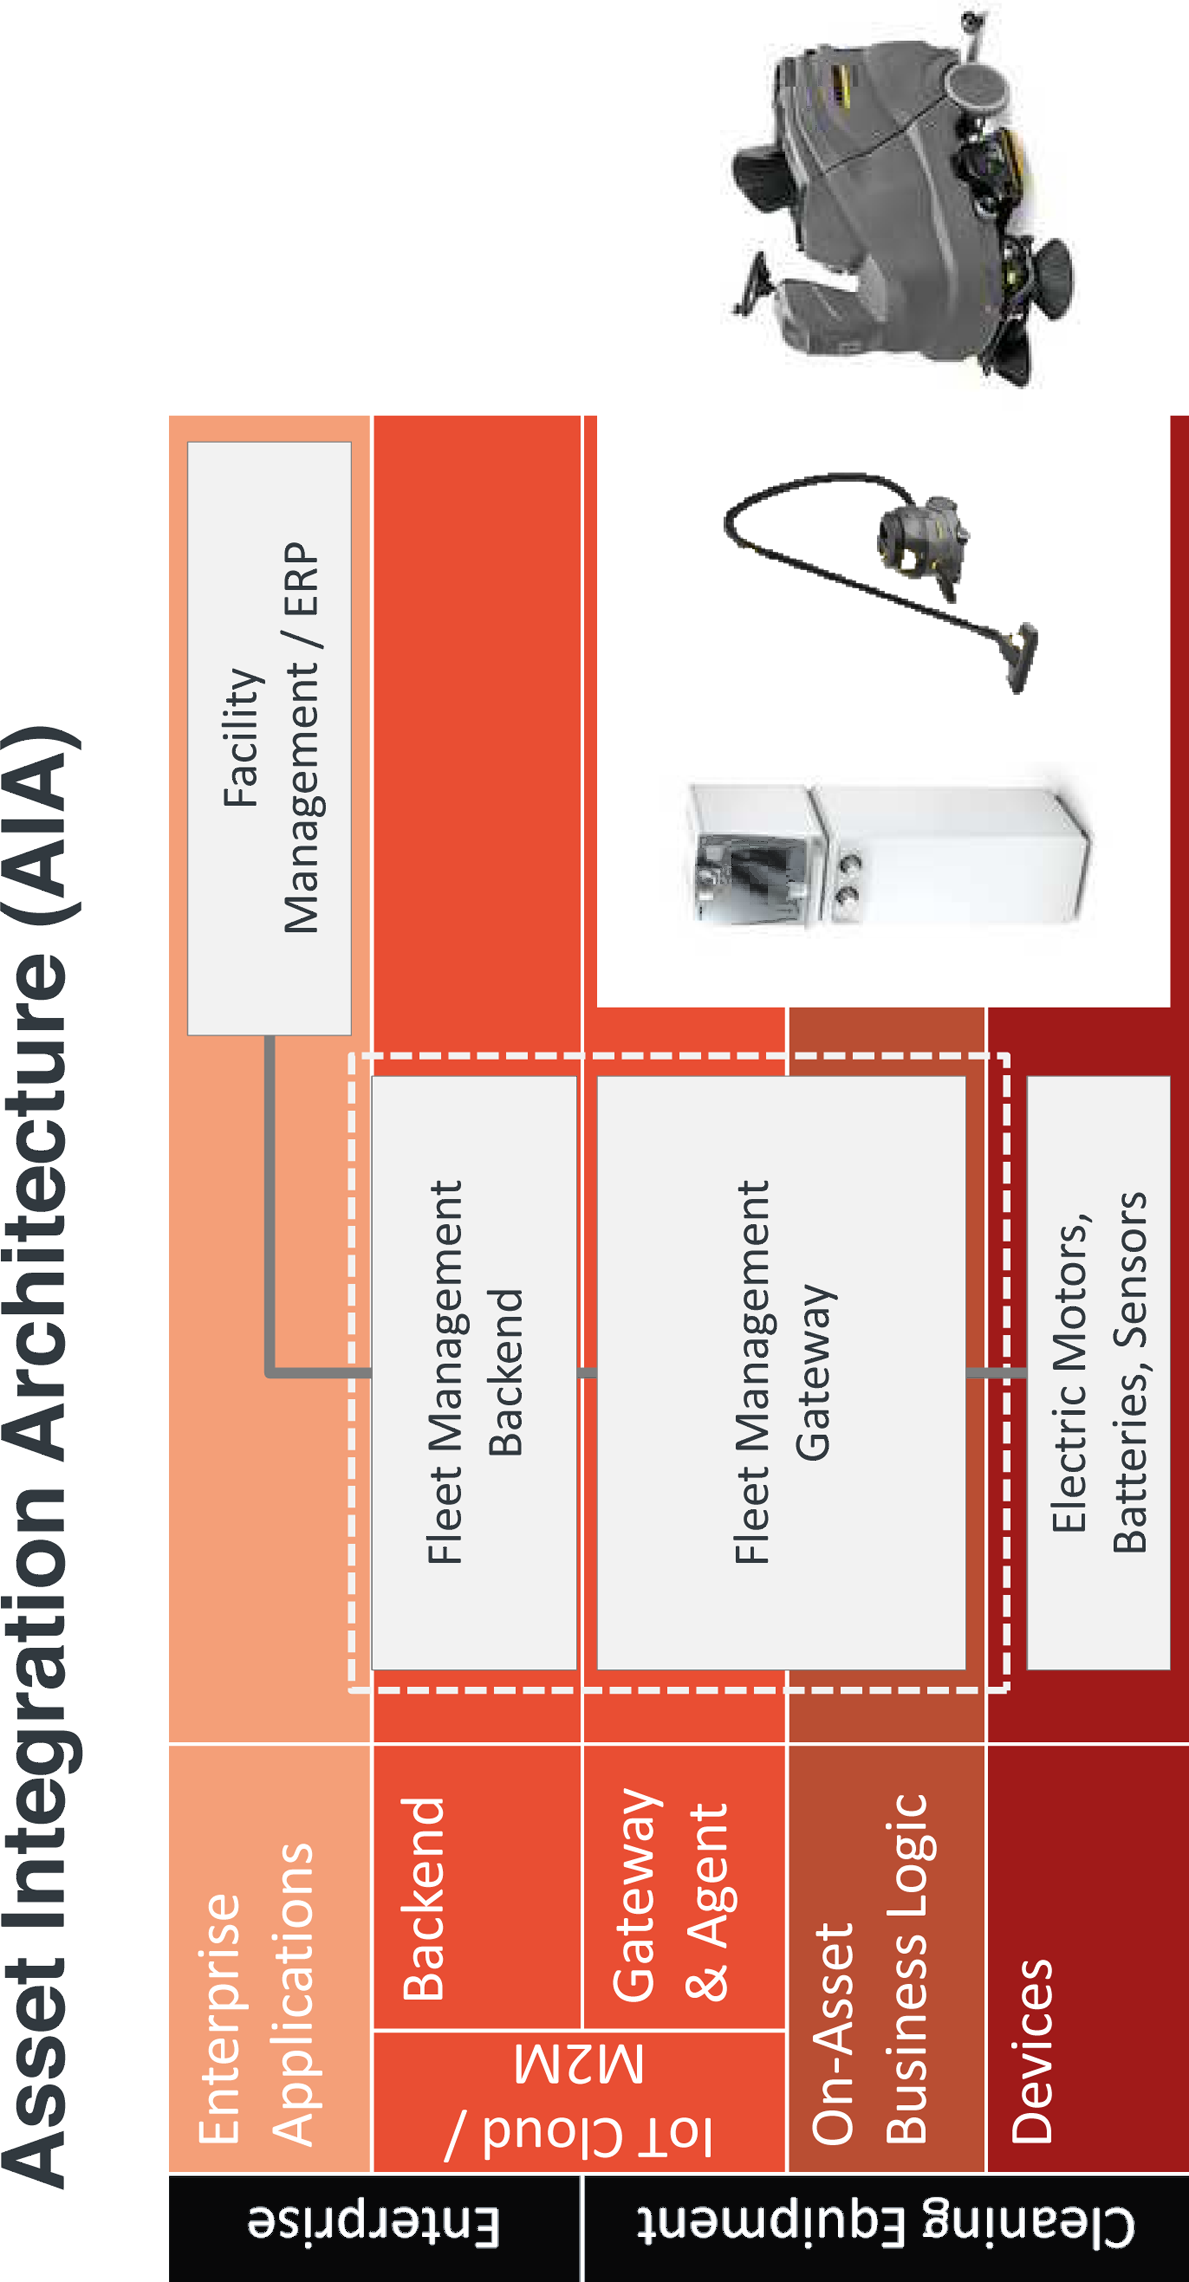
Figure 4-11. AIA for Kärcher Fleet Management
On the asset, a custom-made Fleet Management Gateway aggregates data from devices such as electric motors, batteries, and sensors, and makes this data available to the backend via a cellular network. In the backend, this data is received, processed, and stored in the central asset database, which also serves as the foundation for the portal. Customer-specific applications can be integrated through a set of specialized service interfaces.
Lessons Learned
This section describes some key lessons learned and success factors from this project.
Project Organization
- Management support
Having direct support from the Kärcher board of directors was vital for the success of this project, because of its transformative natureâafter all, this project is a significant step from a pure product business toward a service model. See the discussion in Chapter 1 on servitization and âmachine camp meets Internet campââthis is exactly what is happening here.
- Project management
A small, tightly knit project management team with direct communication channels and a clear focus on management of the interfaces to the various internal and external stakeholders.
- Technology and partner selection
Selection âbest of breedâ components and suppliers based on a clear product vision and the results of the detailed stakeholder analysis.
Product Design
- Customer stakeholder analysis
Detailed customer requirements analysis to ensure that this is not a technology-driven project.
- Evolutionary product design
Small pilot that is developed and productized with lead customers, âdesign to time and budgetâ approach.
- Focus on usability design
As weâll discuss in âUser Interactionâ, getting direct input from customers on key UIs such as the dashboard was important. For these key UI elements, custom UIs were implemented and externally designed by an UI company instead of using predefined widgets.
- Data ownership
Another result of the stakeholder analysis was the reluctance of end customers to include certain sensitive data from their own ERP systems directly in the fleet management solution. Consequently, the solution now supports flexible segregation of data views.
- Openness
A key decision that had to be made was if the hardware and software interfaces should also allow for integration of non-Kärcher equipment. The company eventually decided to do exactly this to provide customers with a comprehensive offering that fits their potentially heterogeneous environment.
- TCO (total cost of ownership)
Cost for solution development and other costs must reflect the individual asset value, as well as the solution value add.
Technology
- Adoption of new technologies
For a medium-sized business, openness for the adoption of new technologies cannot always be taken for granted. In this project, use of new technologies such as Amazon Cloud or Google Services was important.
- Start of asset integration
The time and effort for integrating with the assets should not be underestimated. This is especially true if not all of the required hardware interfaces and sensors are already available and accessible. For example, the project found out that getting âbattery healthâ data directly from the machines is not something that can be taken for granted. Devising and implementing a workaround for this took some time.
- Localization
GPS positioning does not work well in closed buildings. Hence, the project team took to Google Services. At the end, this was more a cost than a technology question.
- Telecom integration
Using a global carrier with a managed service helped ensure 96% availability for GPRS-based communication services.
Transfer from Project to Line Organization
- Know-how
In-sourcing from external suppliers is important and takes time and resources.
- Training and support
Creation and rollout of training concept, including train-the-trainer concept.
- Sales enablement
Definition of pricing model, sales training, and marketing support are very important tasks and need to be planned for accordingly, including resource allocation on both sides of the organization.
- Organizational change
Setup of a new competence center for these kinds of products in the organization is a key instrument to support successful change management.
We would like to thank Dr. Alexander Grohmann, Project Lead Fleet Management at Kärcher, for his support with this case study.
Case Study: Global Cold Chain Management
Perishable supply chain is the market for all commodities that require temperature cold chain management and a controlled environment to transport these products to market. Perishable products include frozen and fresh food, pharmaceuticals, chemicals, and many other specialty products such as flowers, root stock, and plants. The perishable supply chain consists of many forms of transportation such as trucks, trains, ocean vessels, and airplanes that are interconnected through distribution points such as ports and warehouse distribution centers (Figure 4-12).
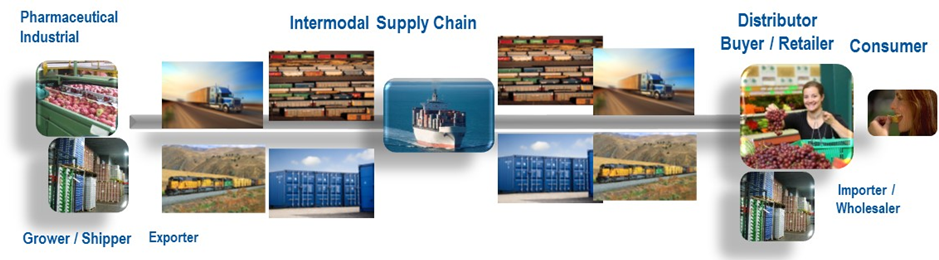
Figure 4-12. Perishable supply chain
The market serves many constituents that work together in partnerships to move the commodities from the point of origin to the destination with performance determined by cost, time, integrity of the cold chain, freshness at destination, safety, and reliability. A perishable supply chain for blueberries from Chile to Europe, as an example, will start with the farmer or grower, who contracts with an ocean carrier to transport from Chile to Europe. The ocean carrier will arrange for a refrigerated cargo container (known by the trade name âreeferâ) to be loaded on a truck carriage at the port and driven to the farmerâs location where the blueberries will be loaded into the reefer and the cold chain management will start. The condition of the blueberries after they are harvested (post-harvest food science) will influence the results of the trip, along with the type of packaging and other environmental effects along the route. The trucker then leaves the farm and transports the product to the port where it is checked in and put in inventory while it is staged for loading onto the vessel. During this inventory period and on the truck, the reefer must be powered so it can maintain temperature. The reefer is then unplugged and loaded on the vessel, with vessel turnaround times at port as short as possible to maximize the on-ocean utilization of the ship. The voyage to Rotterdam is about 30 days on ocean where the product is stored under temperature and atmosphere management. For fresh food, it is important, in addition to temperature management, to control the atmosphere in the container with a recipe that matches the commodity being transported. The controlled or modified atmosphere helps preserve the freshness of the product through reduction of the rate of respiration of the food, reduction or elimination of mold and other plant pathogens, and reduction or elimination of ethylene (a hormone that induces ripening). To stay fresh for this period of time, blueberries require a higher level of CO2 along with other atmosphere modifications such as reduced oxygen levels or injection of ozone, scrubbing or oxidization of ethylene, and strict temperature control. Once the reefer arrives in Rotterdam, it is unloaded from the ship and placed back on a truck trailer for delivery to the importer. The the berries are unloaded, inspected, and then sorted and packaged for delivery to a retail outlet where the consumer can enjoy eating fresh blueberries in January six weeks after the berries were harvested. If there is a problem with the shipment, a process of claims will start where insurance and other parties determine what caused the issue and who is responsible for remuneration.
The market for perishable supply chain is a multibillion dollar global market. The number of refrigerated containers exceeds 1 million and is growing at 4%â5% per year. The demand for fresh and frozen food on a year-round basis is driving this market, as people around the world improve their lifestyles and demand a more nutritious, fresher diet. In addition, the market is shifting from designated reefer ships, which consisted of a few large refrigerated cargo holds, to ships that carry reefer containers. Post-harvest science and controlled atmosphere are also allowing a shift from the use of air cargo to ship fresh food to ocean reefer containers as a much more economical and environmentally friendly method of transportation.
Functional Solution Overview
A high-performing perishable supply chain requires four elements:
- Container resource planning (forecast, planning, tasks, and performance analytics)
Creates the ability to effectively utilize the fleet of refrigerated containers and provide the correct number of units at the right location at the right time for the commodities being shipped.
- Equipment performance MRO (maintenance, repair, and operations)
Assures that the reefer container is operational and will perform for an entire trip to maintain the perishable supply chain. During the trip, the reefer and controller monitor and maintain the conditions required to assure that the highest quality commodity is delivered.
- Cold chain management
The most critical factor in any perishable trip is consistent cold chain management, and the system must provide monitoring and control of temperature throughout the trip.
- Fresh food atmosphere
A percentage of the perishable supply chain is the transportation of fresh food, which requires a controlled atmosphere managed to a recipe to assure the highest quality and freshest food is delivered.
This case study is based on the enterprise solution from Purfresh, which meets the requirements of perishable supply chain management through IntelliFleetâ¢, an innovative SAAS enterprise application, and Intelli-Reeferâ¢, a controller built on an Industrial Internet architecture. This solution provides all four elements for successful perishable supply chain control: fleet planning; forecasting and operations management; maintenance, repair, and operation (MRO); and intelligent cold chain management (ICCM). IntelliFleet provides the ocean and intermodal carriers an innovative technology for the transportation of perishable goods to market. The result is an economical and productive perishable supply chain solution that claims it will help solve the worldwide 50% food waste problem and allow ocean carriers increased productivity and margins.
One of the challenges for such a solution is that has to integrate with a complex logistics system which is already in operation and cannot be interrupted. Says Brian Westcott, PhD, CEO of Purfresh:
The way it works is a grower requests a trip with Purfresh through an ocean carrier. By forecasting demand and working with long-term contracts, Purfresh estimates demand and pre-positions controllers at the ports ready for installation. Once a booking is scheduled, a Purfresh agent installs the unit on a reefer (15-minute process) and presses a switch to start communication (through satellite or GPS) and synchronize with the IntelliFleet cloud software running in Amazonâs Cloud infrastructure. The recipe is downloaded for the commodity set in the booking and real-time monitoring is initiated. During the trip, the reefer is monitored through the IntelliFleet software and alarms are triggered if setpoints or other events take place.
Figure 4-13 shows a screenshot of a trip.
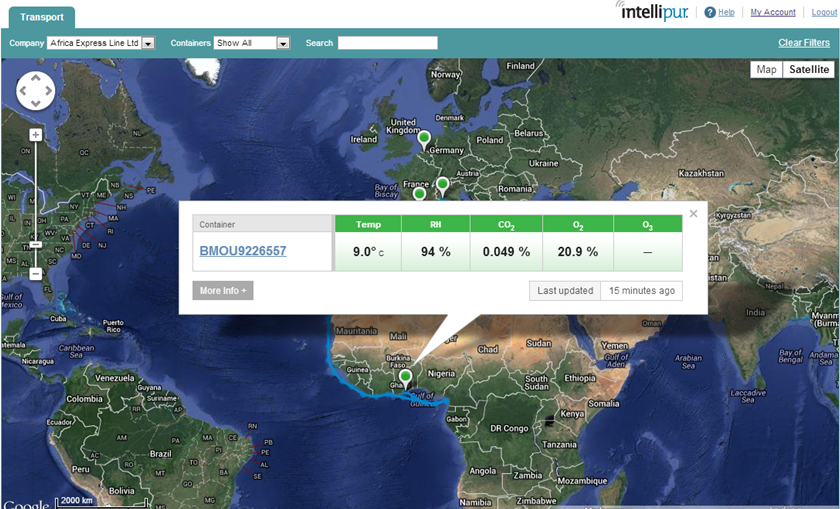
Figure 4-13. Real-time trip monitoring
The system has complete functionality to perform all the functions needed for high-performing perishable trips using remote monitoring and control (Figure 4-14).
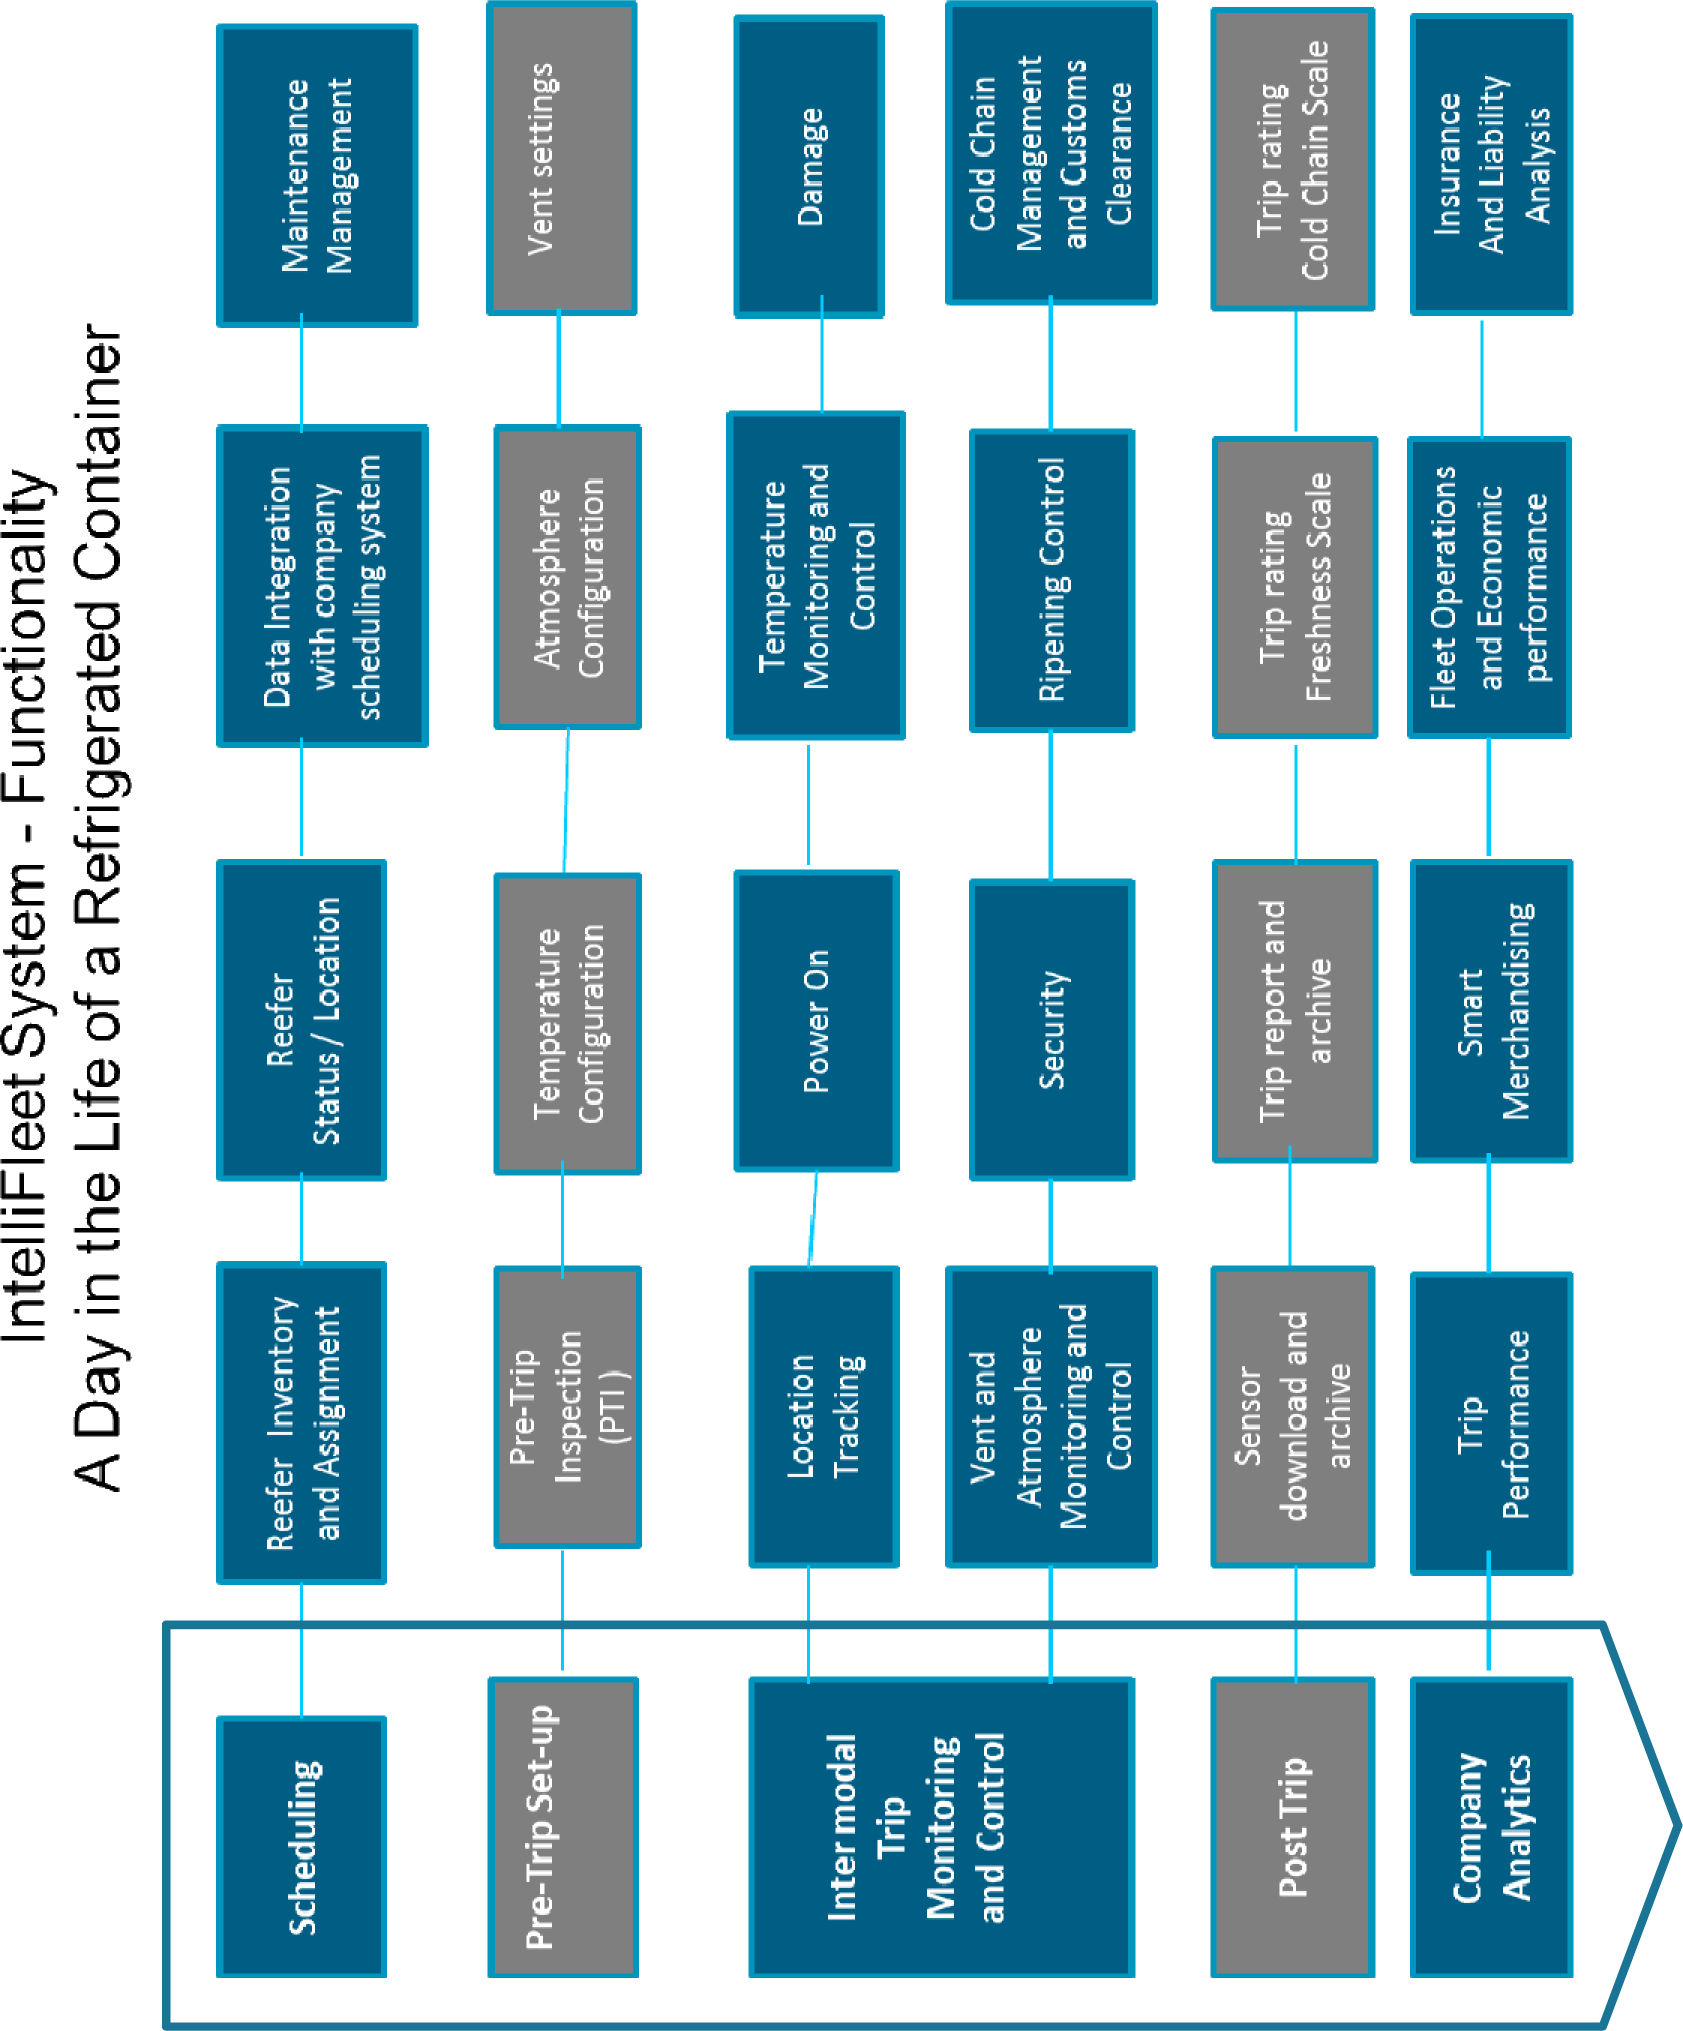
Figure 4-14. IntelliFleet system functionality
When implemented, the IntelliFleet solution turns a static reefer fleet into an automated remote control and monitored or intelligent reefer fleet.
Technical Solution Details and AIA
The IntelliFleet system consists of three main components (shown in Figure 4-15):
- Sensor network
The sensors monitoring temperature, operating parameters, and atmosphere parameters are distributed throughout the container, embedded in the reefer ventilation system, and embedded in the controller.
- Master reefer controller
The reefer controller provides two-way communication to the IntelliFleet cloud application, and real-time control of the actuators for atmosphere control, including ozone generating units and venting valves. The controller also provides real-time data collection and storage, which it uploads through satellite every two hours. The controller also connects to the refrigeration controller and monitors, and can communicate and change operating parameters of the refrigeration controller, making it act as the master controller.
- IntelliFleet Enterprise software application
Provides the organization a complete monitoring and control application for individual reefers, as well as a complete fleet of reefers belonging to a company. IntelliFleet runs different instances for each company.
Figure 4-15 shows how these elements map to the Ignite | IoT Asset Integration Architecture (AIA).
Data is acquired in different time intervals based on the measurement. Ozone and door open light sensor is measured every 1 second. Temperature and CO2 readings are measured every 10 seconds. Accelerometer and power off are measured on an interrupt basis and logged. The atmosphere data is filtered over a 10-minute period and then recorded as a filtered number for that interval. Data is stored in the controller. Communication with satellite is user selected but a normal interval that matches the dynamics of the reefer container is two hours. At two-hour intervals, a packet of information that reflects the current state of the system is transmitted. Also at this time, the controller can receive communication on new setpoints to adjust operation of the system. At the end of the trip or at any time during the trip when a GSM signal is acquired, the complete trip information to that point is downloaded to the cloud and stored.
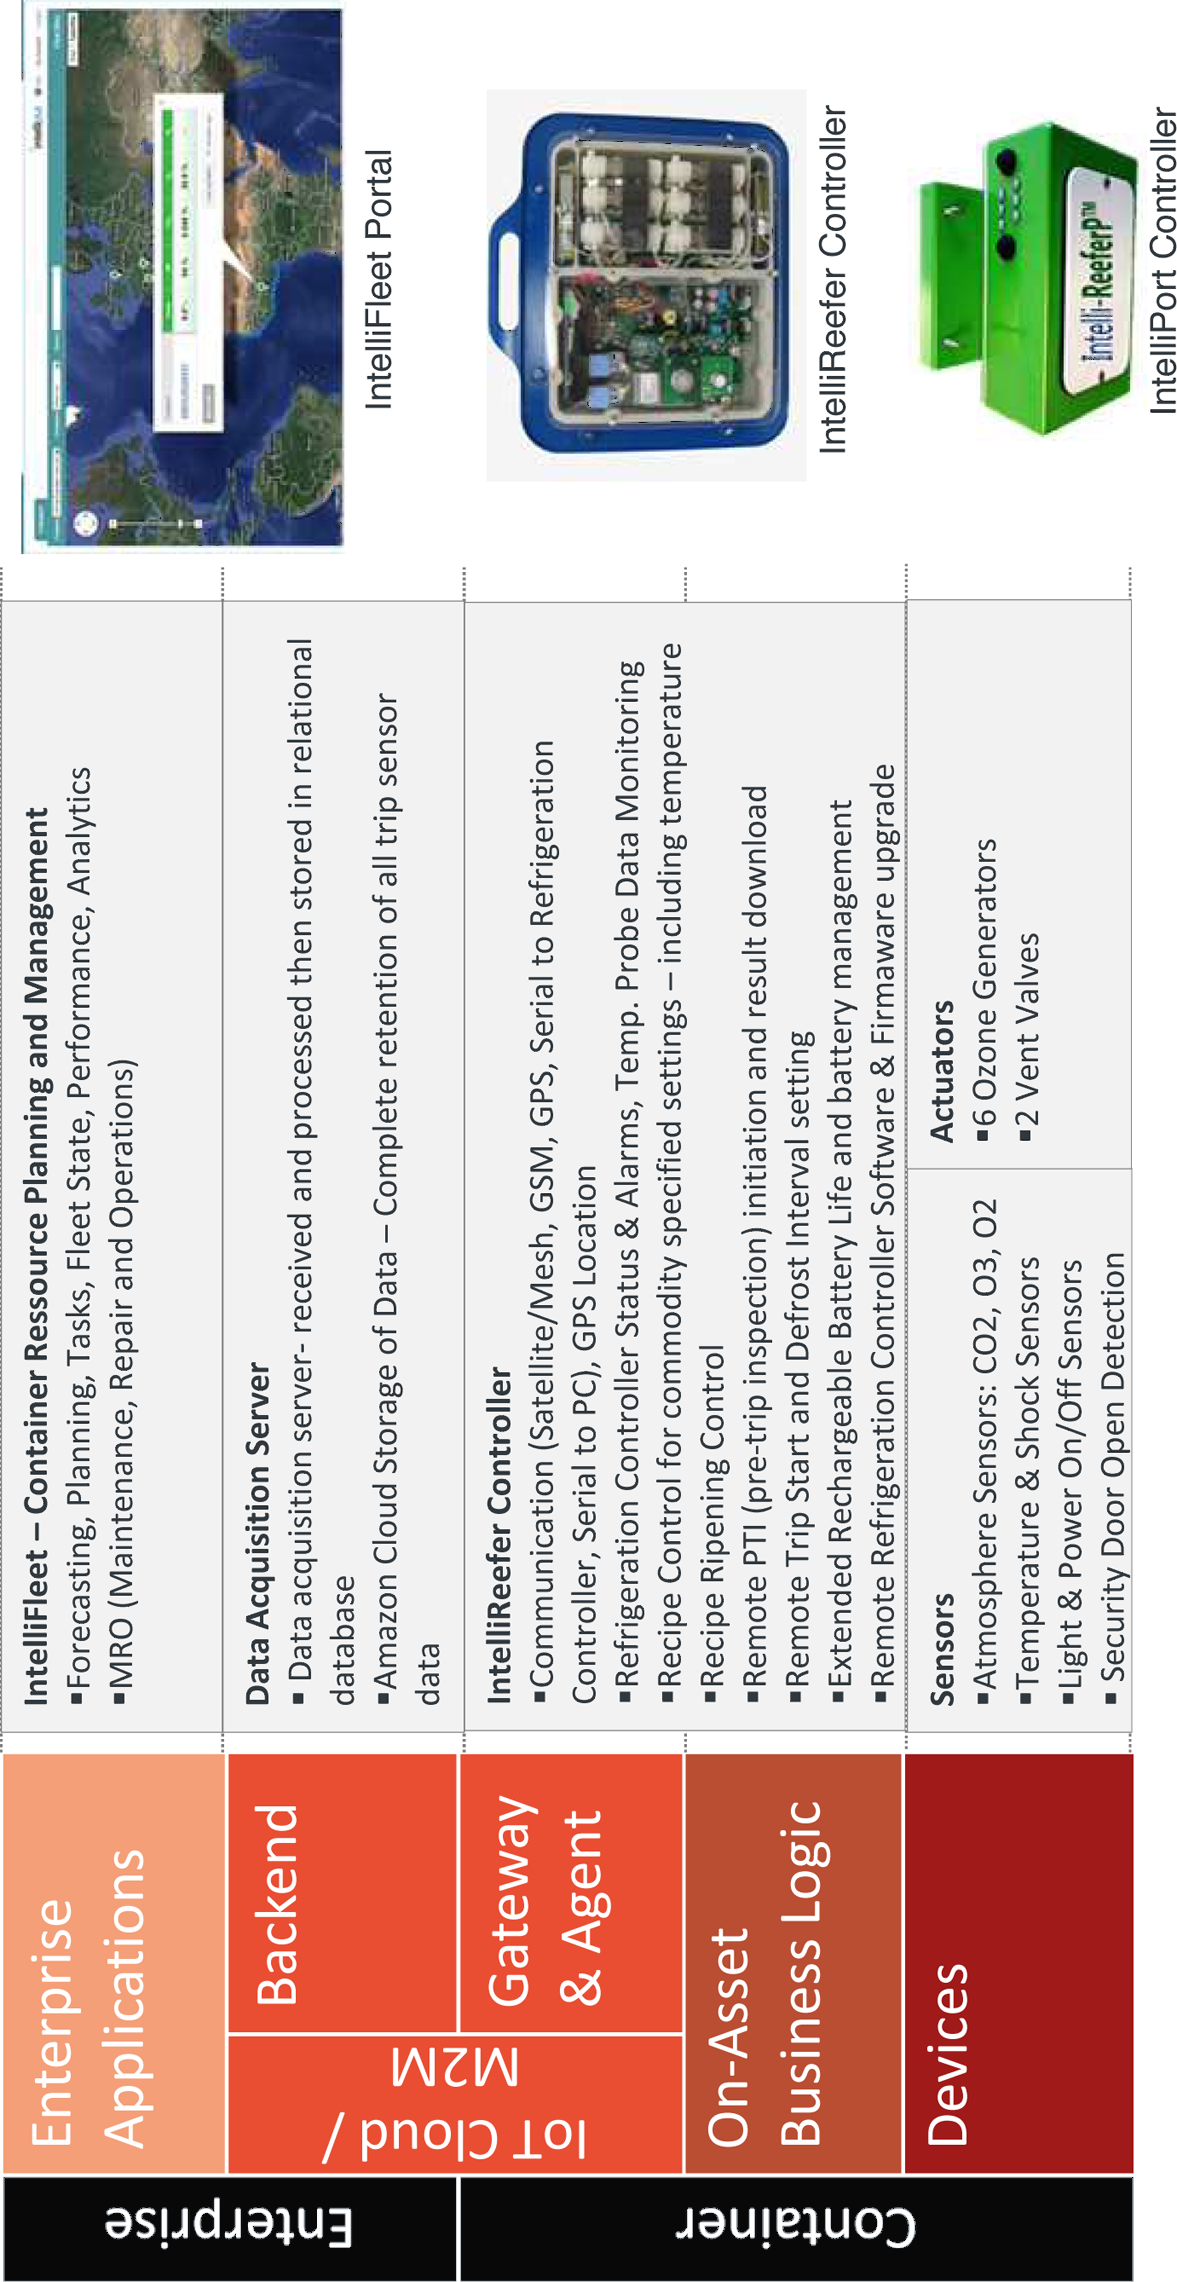
Figure 4-15. Asset Integration Architecture for Intellifleet
Lessons Learned and Recommendations
These are the key lessons learned by the Purfresh team in working with their customers:
- Sensors and calibration
As in most control systems, the sensors are the most critical component, with significant cost and maintenance linked to these devices. Calibration and maintenance of the sensors occurs every few trips. There is constant review of more robust sensors as well as better, faster ways to self-calibrate the system for reduced operating costs and increased robustness.
- Communication infrastructure
It is important in any system to be judicious in the acquisition of data, making sure to time the measurements to the dynamics of the system being monitored and controlled. The communication infrastructure for this system can become expensive if excessive data is transmitted over satellite, so the key to performance is filtering the data and transmitting enough information to accurately give the state of the system, but not transmitting excessive data.
- Cloud computing
The inexpensive and reliable infrastructure available through a third-party cloud computing environment has made the solution possible. As costs continue to decrease, more information will be stored and analyzed to improve perishable supply chain performance.
- Training
The human side of system performance cannot be neglected when converting to a more automated system with remote operation. Training becomes essential to the use of the system and confidence that it will provide superior service to the end customer. Layers of training should be implemented, including classroom type as well as one-on-one mentoring of operation of the live system. Training should include ongoing support through a strong customer service group.
- Diffusion of innovation and organization change
The perishable supply chain is a complicated set of tasks requiring coordination of capital equipment. The system must be responsive to the variations caused by dealing with nature and biology. Schedules can easily become late due to weather or other natural events. The most difficult part of introducing any new innovation is changing the organization to work in a different way. At first, this will be uncomfortable and many people will find excuses on why the new system will not work correctly in this type of environment. Change is not easy, and most people resist change to some degree because they worry both that the customer will not receive the level of service that was previously delivered and that they as employees will not be able to adapt and learn the new skills necessary to operate a new system.
We would like to thank Brian J Westcott, CEO of Purfresh, for his contribution.
Case Study: LHCb Experiment at CERN
CERN, the European Organization for Nuclear Research, operates particle accelerators needed for high-energy physics research. Currently, CERN operates a network of six accelerators. Each accelerator increases the energy of particle beams before delivering them to the various experiments or to the next more powerful accelerator in the chain. The Large Hadron Collider (LHC) is the largest of these six accelerators. Located 100 meters underground, the LHC consists of a 27-km ring of superconducting magnets to control particle beams, as well as accelerating structures to boost the energy of the particles in the beams. Inside the LHC, two particle beams traveling in opposite directions at close to the speed of light are made to collide. This is comparable to firing two needles 10 kilometers apart with such precision that they collide in the middle. The machinery required to perform these kinds of experiments weighs tens of thousands of tons and must be capable of withstanding conditions similar to those that prevailed when life on the universe first began, such as high levels of radioactivity and extreme temperatures, for example.
There are currently four major experiments underway at the LHC. One of theseâthe LHCb experimentâis the main focus of this case study. It is installed in a huge underground cavern built around one of the collision points of the LHC beams. The purpose of the LHCb is to search for evidence of antimatter. This is done by searching for a particle called the âbeauty quarkâ (hence the âbâ in LHCb).
Like the other experiments, LHCb is designed to examine what happens when certain particles traveling at the speed of light collide. At the point of impact, many particles are generated. Some of these particles are very unstable and only exist for a fraction of a second before decaying into lighter particles. For more information on the physics theory behind all this, see [CERN09].
LHCb and Data Management
The LHC generates up to 600 million particle collisions per second (out of 40 million beam crossings = 40 MHz). A digitized summary of each collision is recorded as a âcollision event.â At the time of writing, CERN stores approximately 30 petabytes of data each year. This data needs to be analyzed by the physicists in order to determine if the collisions have yielded any evidence to prove their theories.
The LHCb experimentâs more than 1,000,000 sensors generate colossal amounts of data. It will be some time yet before it is possible to store and analyze all of the analog data produced by these vast armies of sensors. According to Sverre Jarp, recently retired CTO of CERN openlab:
Since it is impossible to manage and retain all of the massive amounts of analog data created by the LHC, weâve had to devise a strategy for efficiently digitizing, compressing, filtering, and distributing this data for further analysis. Our solution to this problem is the Worldwide LHC Computing Grid (WLCG). The WLCG is a massive grid of low-cost computers used for pre-processing LHC data. We then use the World Wide Webâalso invented at CERNâto give more than 8,000 physicists near real-time access to the data for post-processing.
As Andrzej Nowak, who worked closely with Sverre Jarp during his long-standing tenure at CERN openlabs, explains:
Our challenge is to find one event in 10 trillion. Since we canât retain all of the analog data created by these 10 trillion events, we have to filter some of the data out. This upsets our physicists, because they are afraid we will throw away the one golden grain that will make it all worthwhile. So we need two things: Firstly, massive scale to ensure that we can keep as much data as possible. Secondly, intelligent filtering to ensure that we are really only throwing away the white noise, and keeping all the good data.
In order to address these challenges, the LHCb team has set up a multitiered approach to managing the data produced by these experiments (for an overview, see Figure 4-16):
[A] Over 1,000,000 sensors are deployed inside the detector in the main LHCb cavern, right after the point of the primary particle collision (2). Once the collision has taken place, magnets are used to disperse the secondary particles, so that all sensors can capture parts of the now evenly distributed particles. Given the nature of the experiment, this area is highly radioactive when experiments are in progress. The sensors themselves are organized into different groups. For example, the main tracker contains sensors to help reconstruct the trajectories and measure the speed of charged particles. The electromagnetic and hadronic calorimeters measure the energy of electrons, photons, and hadrons. These measurements are then used at trigger level to identify particles with so-called âlarge transverse momentumâ (see [C]).
[B] In order to protect the computer equipment from the high levels of radiation, the analog data from the sensors is transferred through a massive concrete wall via a glass-fiber network. The data transfer rate corresponds to 1 MHz. The first tier of this system for processing analog data comprises a grid of field-programmable gate arrays (FPGA) units tasked with running high-performance, real-time data compression algorithms on the incoming analog data.
[C] The compressed sensor reading is then processed by a large grid of adjacent general-purpose servers (>1,500 servers) to create a preliminary âreconstructionâ of the event. This processing tier uses detailed information about the sensorsâ 3D positions in order correlate the data from the different sensors. If this analysis yields a so-called âtrigger,â a snapshot is created. For each trigger event of this type, the event data (i.e., the snapshot of all sensor data at that point in time) is written to a file, which is then transferred via LAN to the external data center (i.e., above ground). On completion of this step, the data transfer rate drops from 1 MHz to 5 KHz.
[D] The main CERN Data Center (shared with the other experiments) corresponds to Tier 0 of the system and consists of a grid of off-the-shelf computers for processing the data, as well as a farm of tape robots for permanent data storage. The input processing capacity of the data center for the LHCb is 300 MB per second. In addition to storage management, the main task of this data center is to ensure the âsafeâ offline reconstruction of events, which is something we will explain in more detail in the next section.
[E] From Tier 0/CERN, the data is distributed to twelve Tier-1 sites in different countries. It is transferred via dedicated 10-GB network connections, which enable the creation of new copies of the experimental data.
[F] About 200 Tier-2 sites receive selected data for further analysis and produce detector simulation data (to optimize and calibrate the detector and analysis.) Most of these sites are universities or other scientific institutions.
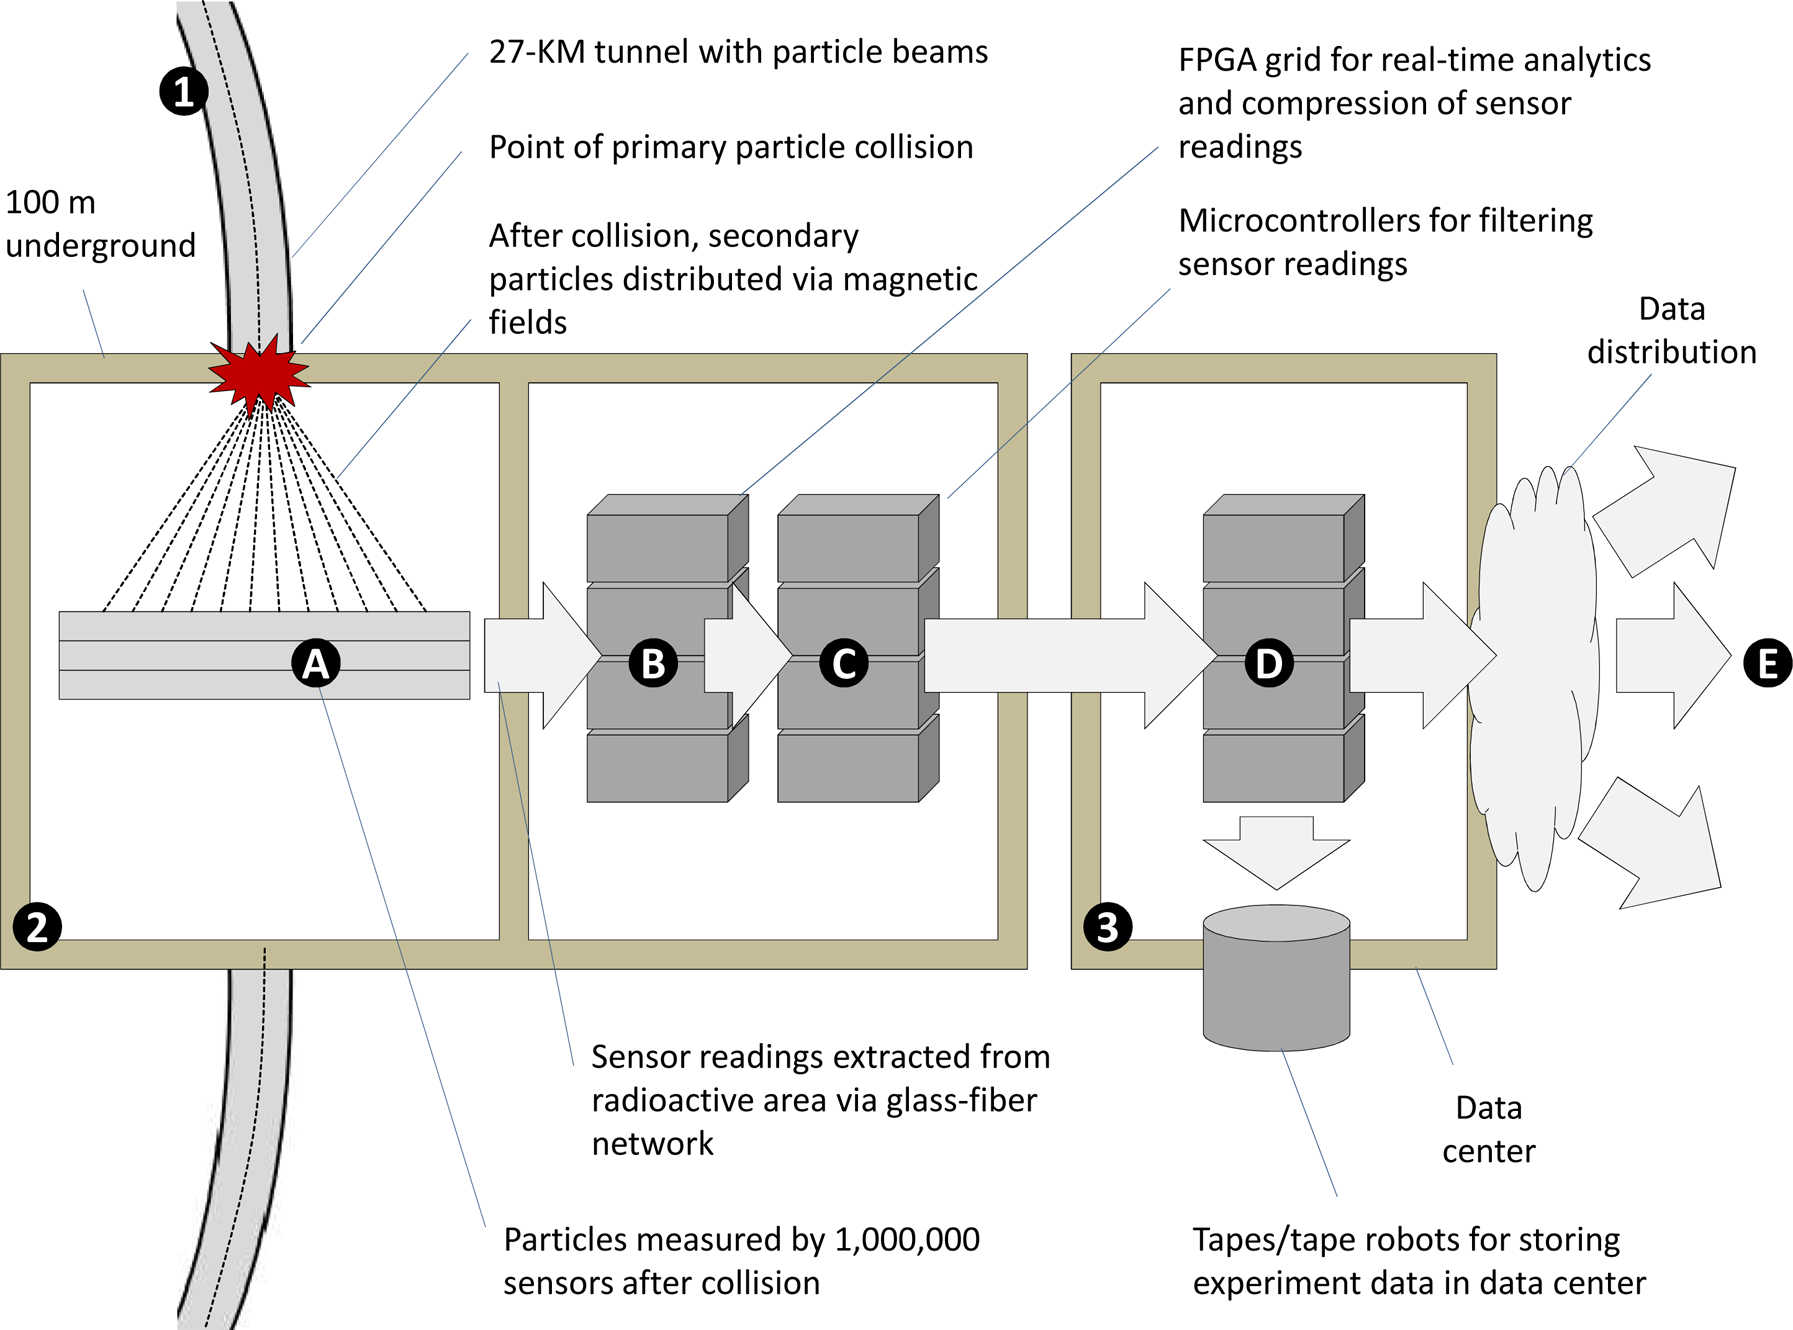
Figure 4-16. Data management for LHCb experiment
The multitiered approach chosen by CERN for the management of its data has proven very efficient. CERN only has to provide 15% of the overall capacity required to process the data from the different experiments, with no need for a super computer. According to Massimo Lamanna, Section Leader of the Data Storage Services (DSS) group:
The data from each collision is relatively smallâon the order of 1 to 10 MB. The challenge is the enormous numbers of collisions that require the collection of tens of petabytes every year. Because each collision is completely independent, we are able to distribute the reconstruction process across multiple nodes of the CERN computer center and WLCG grid. Surprisingly enough, the calculations we perform can be done very effectively using large farms of standard PC (x86) servers with two sockets, SATA drives, standard Ethernet network, and Linux operating systems. This approach has proved to be by far the most cost-effective solution to our problem.
In order to increase processing capacity and ensure business continuity, CERN has recently opened a second data center in Budapest, Hungary. This data center acts as an extension of the main computer center at the Geneva site, and uses the same hardware and software architecture as the original data center. Budapest provides an additional 45 petabytes of disk storage, bringing the total number of processing cores to 100,000.
LHCb and Physical Data Analysis
Without going into the physics theory underlying the LHCb experiment in too much detail, we will take a brief look at data analysis from a logical perspective. As we will see later, there is a lot we can learn here, even as nonphysicists.
Figure 4-17 illustrates the approach.
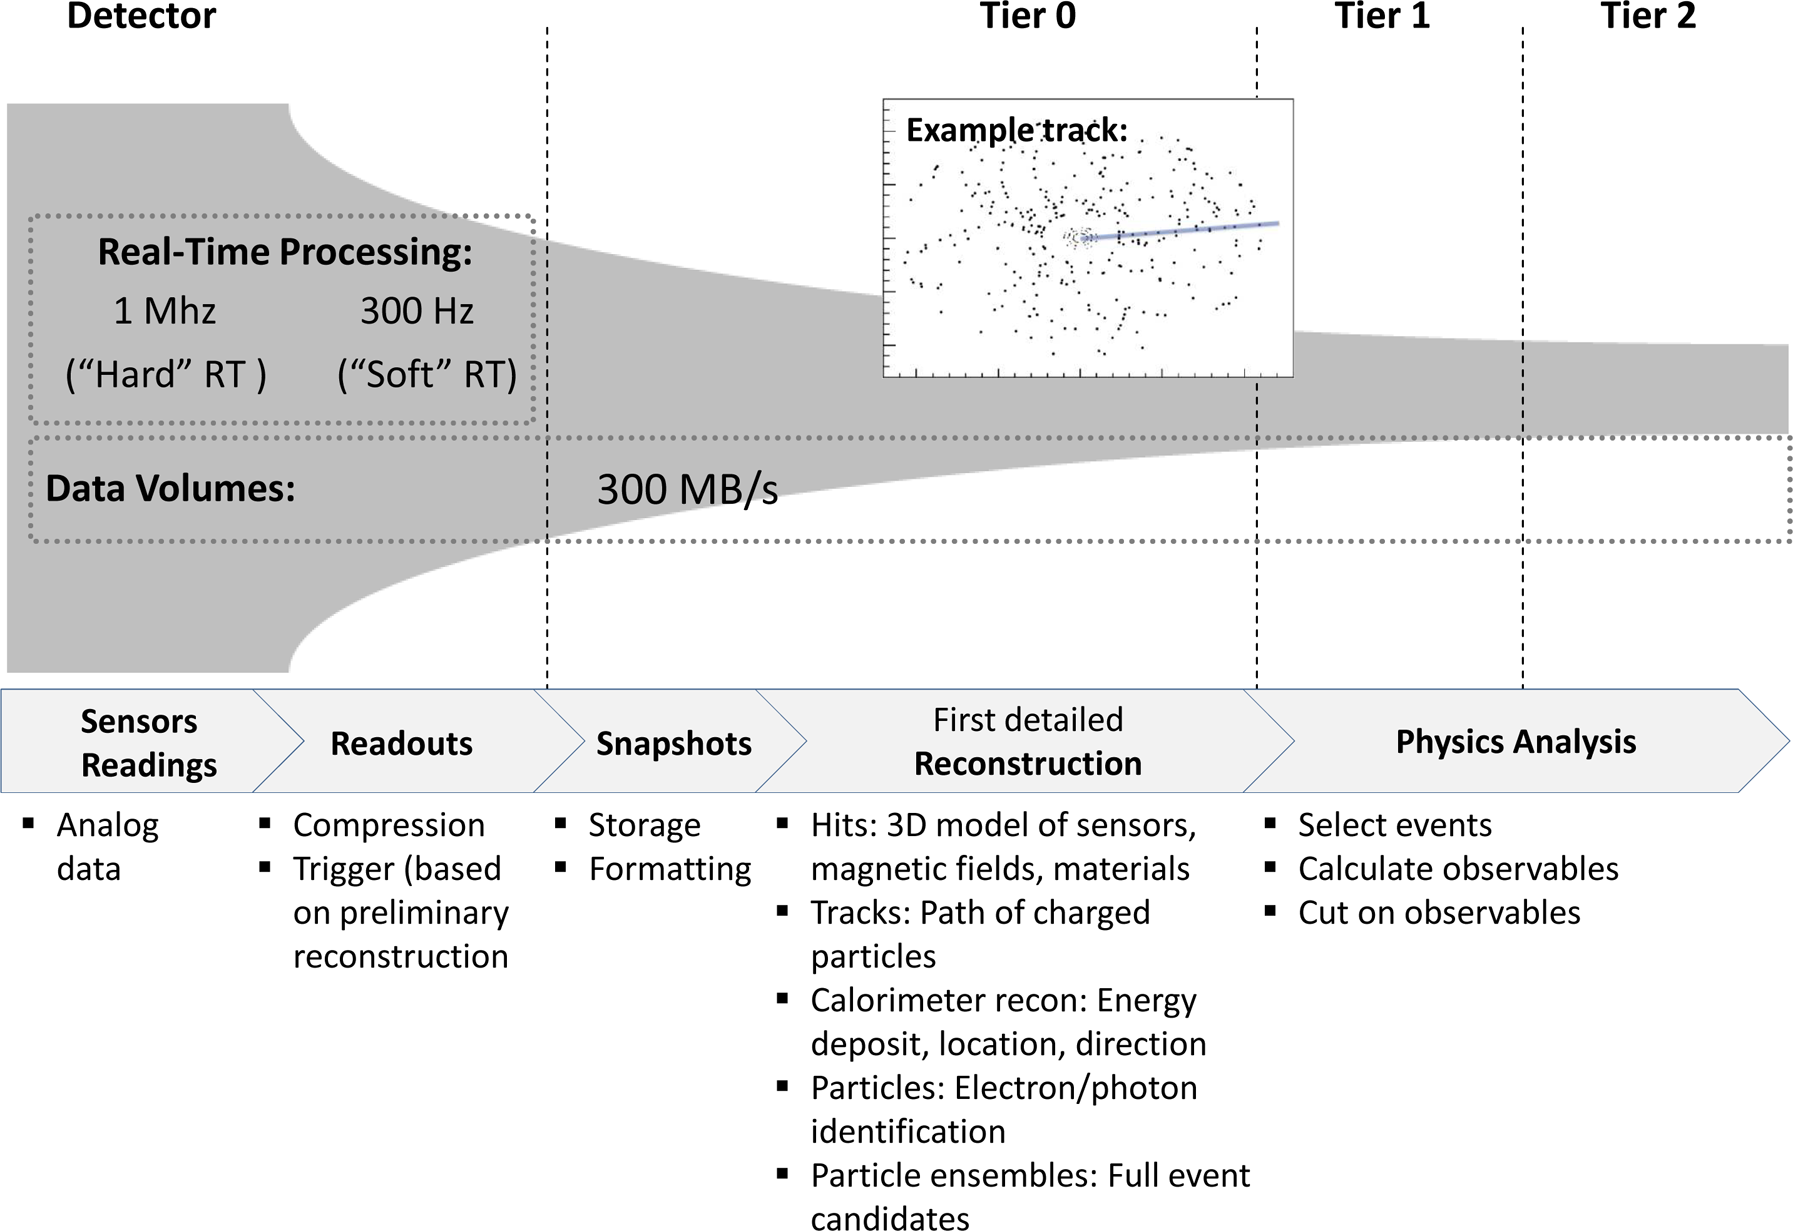
Figure 4-17. Logical data analysis
The collisions create numerous secondary particles that need to be detected. These secondary particles move through a 3D space based on a given trajectory, speed, and other factors. The raw analog data is delivered by sensors: a collection of points through which the particles pass. Because the amount of raw analog data is much too large to be processed by standard IT systems, a combination of FPGAs and microcontrollers work together to create âtriggers,â which initiate the generation of readouts (i.e., a collection of all sensor data existing at a given point in time).
These readouts are transferred to the data center, where they are stored and undergo basic formatting operations in order to create snapshots of the status of the detector.
One of the main processor-intensive tasks performed at the Tier-0 data center is the reconstruction process. Individual hits (detected by an individual sensor in a 3D space) are correlated and grouped to form trajectories (i.e., the path of a charged particle through the detector). Energy deposits from charged and neutral particles are detected via calorimeter reconstruction, which helps to determine exact energy deposit levels, location, and direction. Combined reconstruction looks at multiple particle trajectories, in order to identify related electrons and photons, for example. The final result is a complete reconstruction of particle ensembles.
These particle ensembles are then made available to physicists at Tier-1 and Tier-2 centers. The general goal of the physics analysis performed at the Tier-1 and Tier-2 level is to identify new particles or phenomena, and to perform consistency checks on underlying theories. Scientists working at this level often start with a simulation of the phenomenon they are examining. The output of the Tier-0 reconstruction phase is then further refined and compared with predictions from the simulation. When combined, simulation and Tier-0 experiment data often comprises tens of petabytes of data.
LHCbâs Asset Integration Architecture
Figure 4-18 provides an overview of the Asset Integration Architecture (AIA) of the LHCb experiment.
For the purposes of our case study, the primary asset is the detector; we will not be looking at the collider itself. The detector is supported by three main systems:
- Data Acquisition System (DAQ)
The DAQ is a central part of the detector and responsible for crunching the massive amounts of analog data into manageable levels from a digital perspective. The devices are mainly radiation-hard sensors and chips. The Local Asset Control for the DAQ consists of a farm of FPGAs and microcontrollers that compress and filter the sensor readings, discussed previously.
- Detector Control System (DCS)
The DCS manages the LHCb experiment. It is mainly based on standard industry componentsâfor example, a standard SCADA system is used for the DCS.
- Detector Safety System and Infrastructure (DSS)
The DSS runs critical components for cooling water, gas supplies, and so on. The DSS uses standard PLCs for managing these mainly industrial components.
With the exception of the DAQ, the LHCb is constructed like a normal industrial machine (admittedly a very big and complex one). Both the DCS and DSS use standard industry components. However, the device layer can only use radiation-hard components, while the DAQ makes the LHCb one of the best existing examples of âBig Dataâ at work.
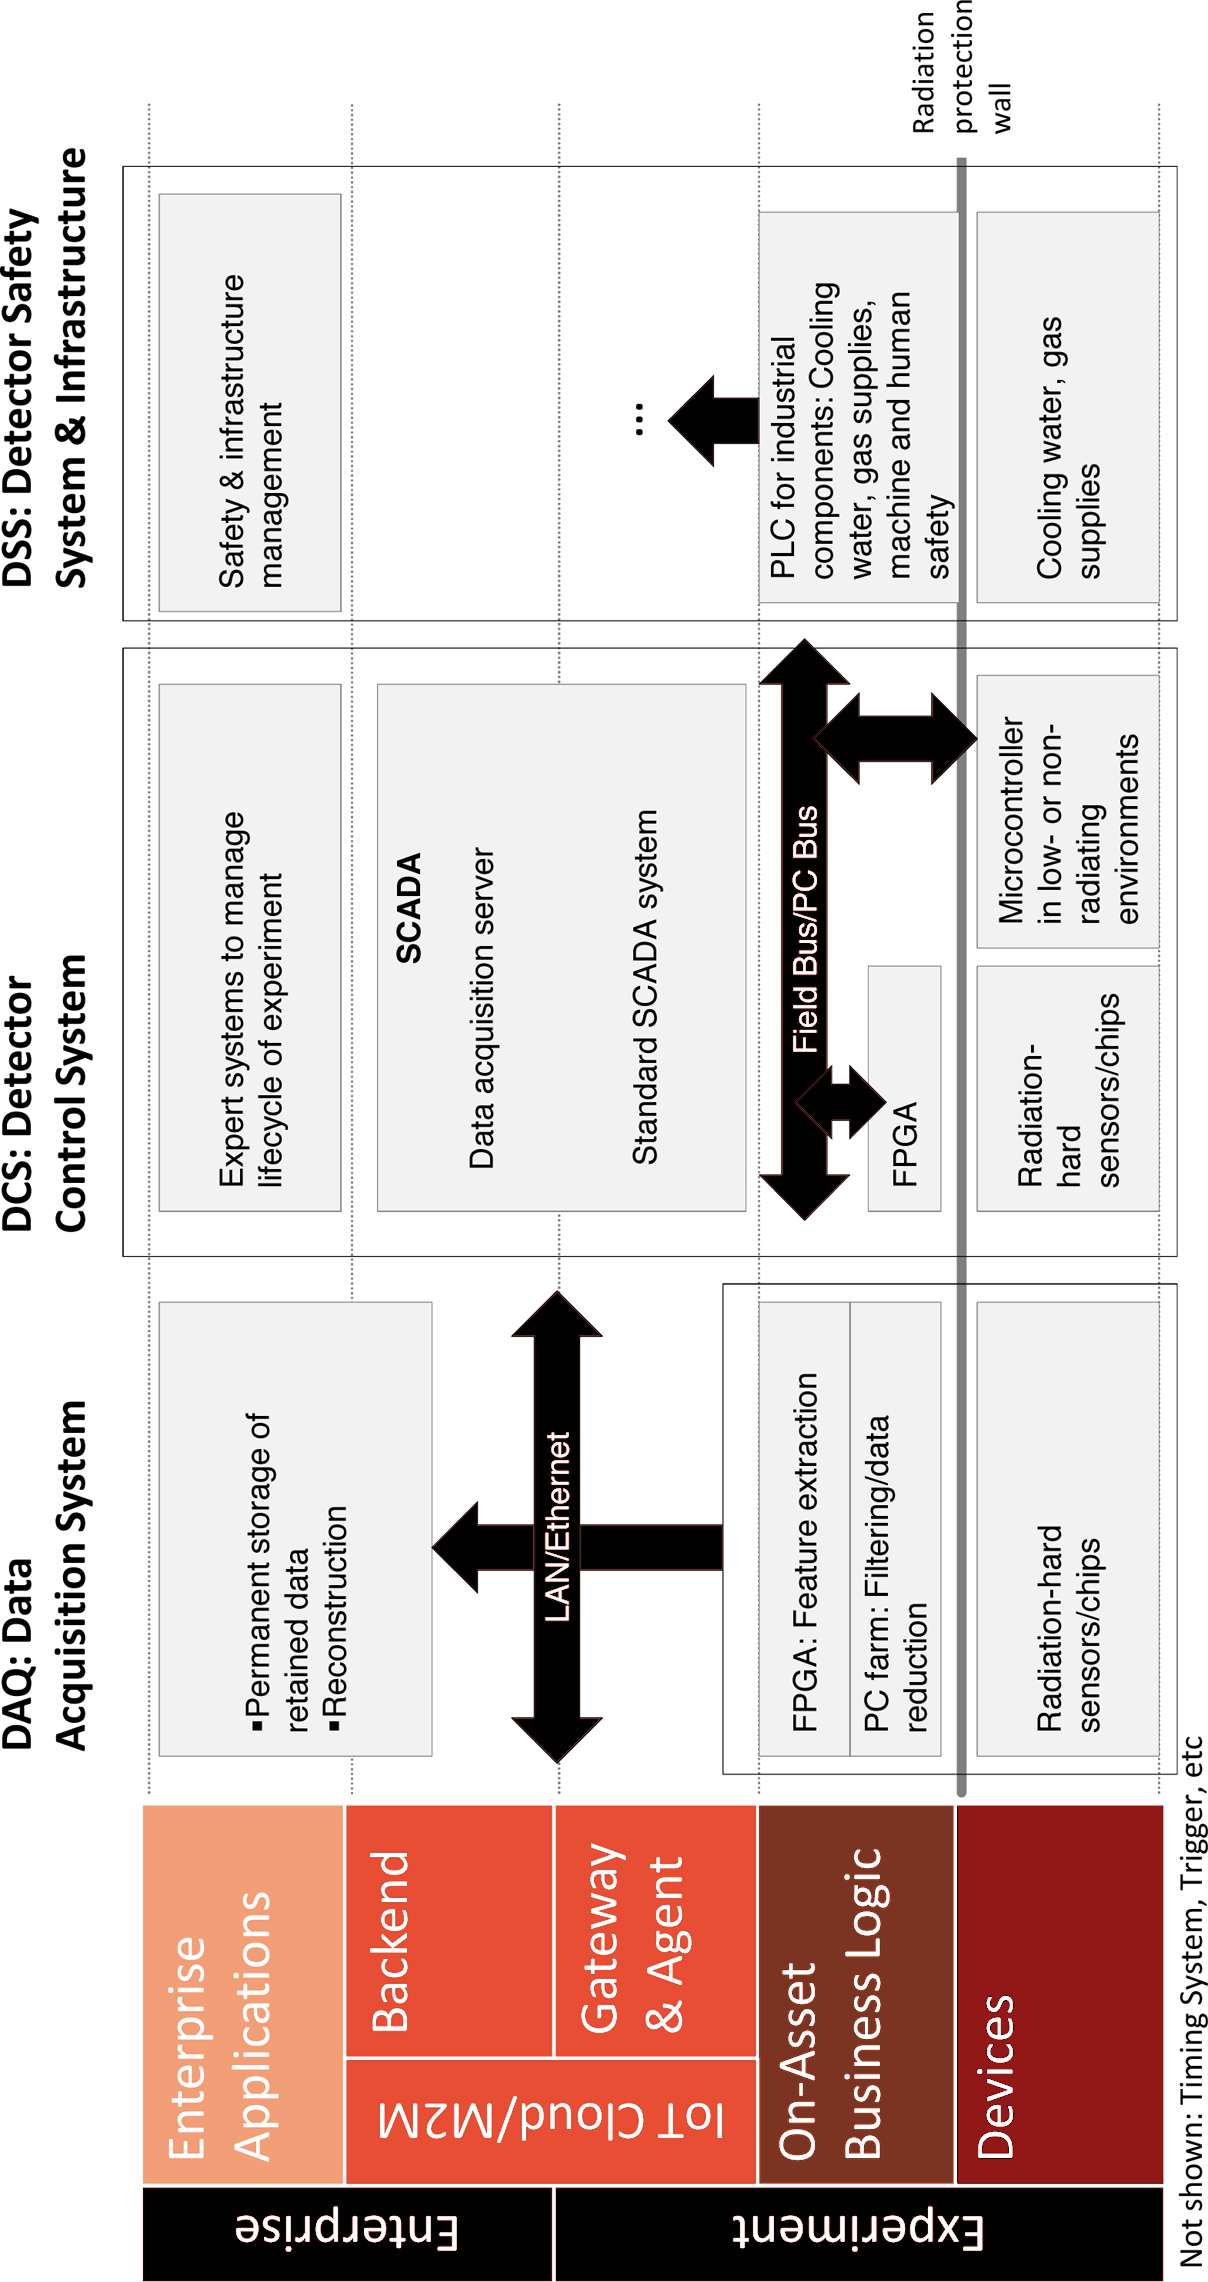
Figure 4-18. Asset Integration Architecture for LHCb
Lessons Learned and Outlook
This case study provides quite a few lessons that we believe can be applied to many IoT and Big Data projects in other domains.
- Use of multitiered architectures for Big Data capturing and processing
The entire data processing cycle is based on multiple, highly specialized tiers that together act like a big funnel, with each tier performing specialized data filtering and enrichment functions. Tier 0 performs the basic data reconstruction and distribution tasks, while Tier 1 and Tier 2 focus on different types of physics analysis. CERN has succeeded in outsourcing 85% of its data processing resources to Tiers 1 and 2. And even between the detector itself and the Tier-0 data center, the data passes through multiple layers involving multiple steps, from high-performance compression, to initial filtering, through to reformatting and reconstruction. Each tier and layer performs an optimized function.
- Use of specialized hardware for high-performance analog data processing
The LHCb uses a grid of high-performance field-programmable gate arrays (FPGAs) for the real-time processing of analog data and conversion into compressed digital data. The benefit of this FPGA grid is that it can be reprogrammed at a software level based on specialized hardware description language (HDL). In many cases, FPGAs are used as the âfirst frontierâ in the real-time processing of analog data, before being passed on to a âsecond frontierâ of even more flexible but less real-time microcontrollers. The âhardâ real-time processing that occurs at this level is also a prerequisite for the use of time as a dimension in the correlation of data, which is something we will cover in the next point.
- Correlation of sensor data
Correlating data from different sensors is a key prerequisite for making sense of the âbig picture.â At CERN LHCb, this is done using the 3D positions of all sensors in combination with timing information. Conceptually, tracking the movements of particles through a 3D detector is not so different from tracking the movements of customers through a shopping center, for example (except for scale and speed, of course).
- Leverage grid computing
Because data structures and analytics patterns allow the division of processing tasks into different chunks, it is possible to use grids of inexpensive, standard hardware instead of more expensive, high-performance or even super computers.
And finally, another important lesson relates to the need to bring advanced filter logic as close to the data source as possible. As Niko Neufeld, LHCb Data Acquisition Specialist, explains:
The goal should be to enable the trigger system to perform a full data reconstruction close to the sensors. This should help us to dramatically improve the way we decide which data is to be kept as close as possible to the data source, thus minimizing the chances of critical data slipping through the net as a result of the initial data filtering step in the DAQ.
The authors would like to thank Sverre Jarp, Andrzej Nowak, Massimo Lamanna, and Niko Neufeld for their input in this case study. The work carried out at CERN has been associated with numerous Nobel Prizes, not least by helping to validate the work of Higgs-Engelman, recipient of the Nobel Prize for Physics in 2013, and provides a solid basis for the establishment of best practice in the area of IoT and Big Data.
Get Enterprise IoT now with the O’Reilly learning platform.
O’Reilly members experience books, live events, courses curated by job role, and more from O’Reilly and nearly 200 top publishers.

