Now that the entire setup is done, we will start pumping data into the Elasticsearch:
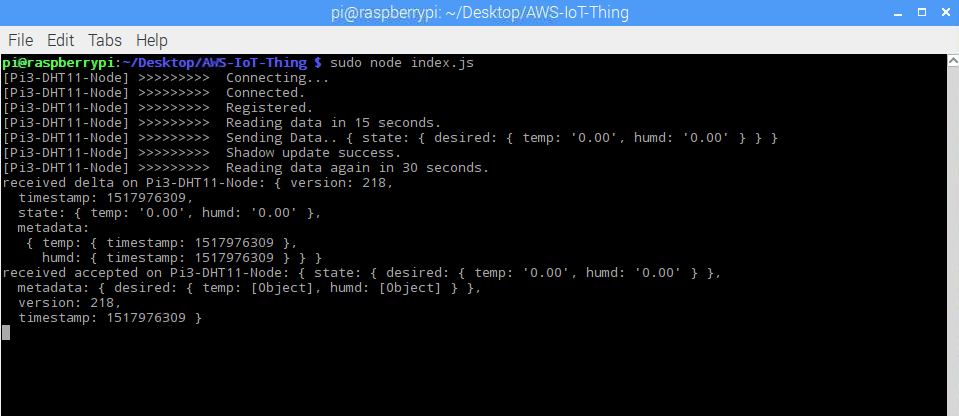
- Head back to Raspberry Pi 3, which was sending the DHT11 temperature and humidity data, and run our application. We should see the data being published to the shadow topic:
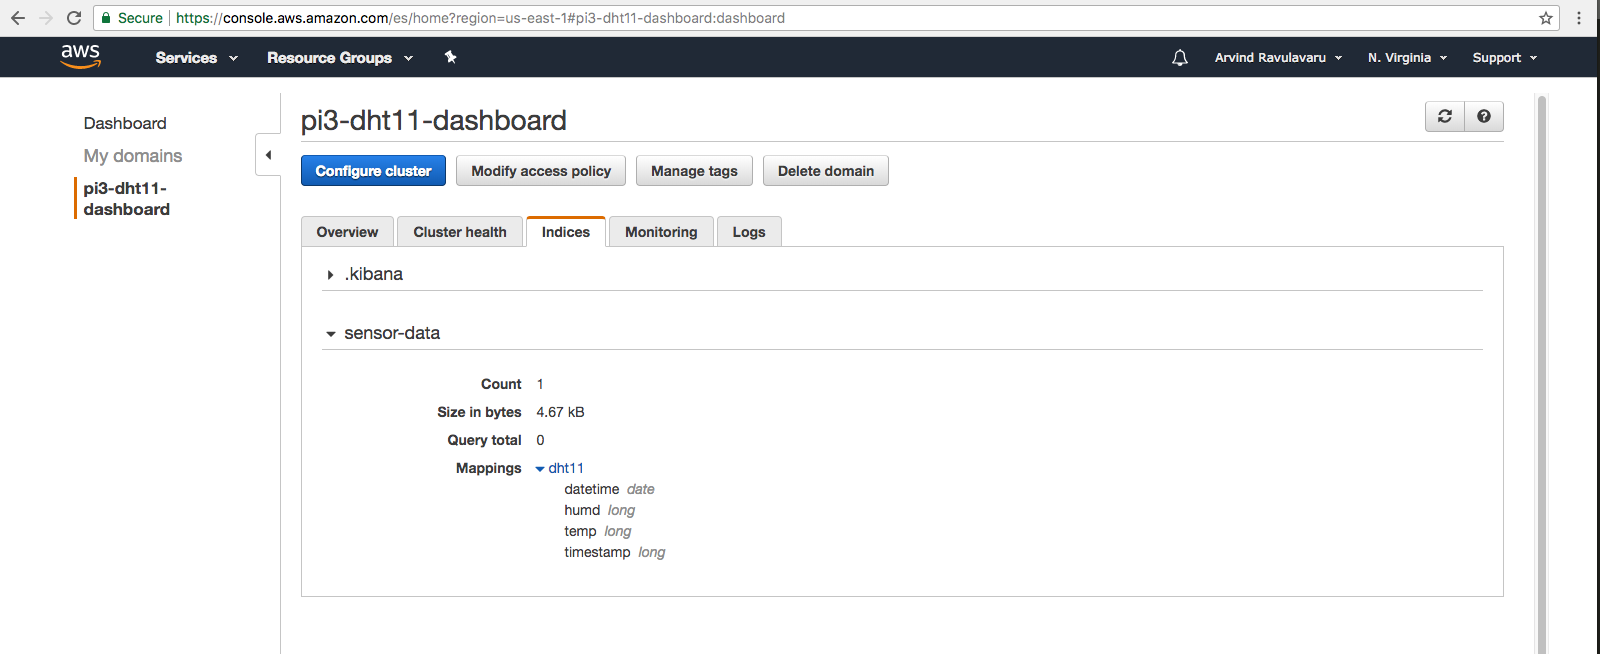
- Head over to the Elasticsearch page, to the pi3-dht11-dashboard domain, and to the Indices tab, and you should see the screen illustrated here:
- Next, head over to the Kibana dashboard. Now we will configure the Index pattern as shown in the following screenshot:

