Start the Kaa client app on the Raspberry Pi, if it is not already running. This will start sending data to MongoDB, the Node.js server, and the ThingsBoard server:
- Head over to the Devices page on ThingsBoard and click on the LATEST TELEMETRY tab and we should see the data coming in as shown:

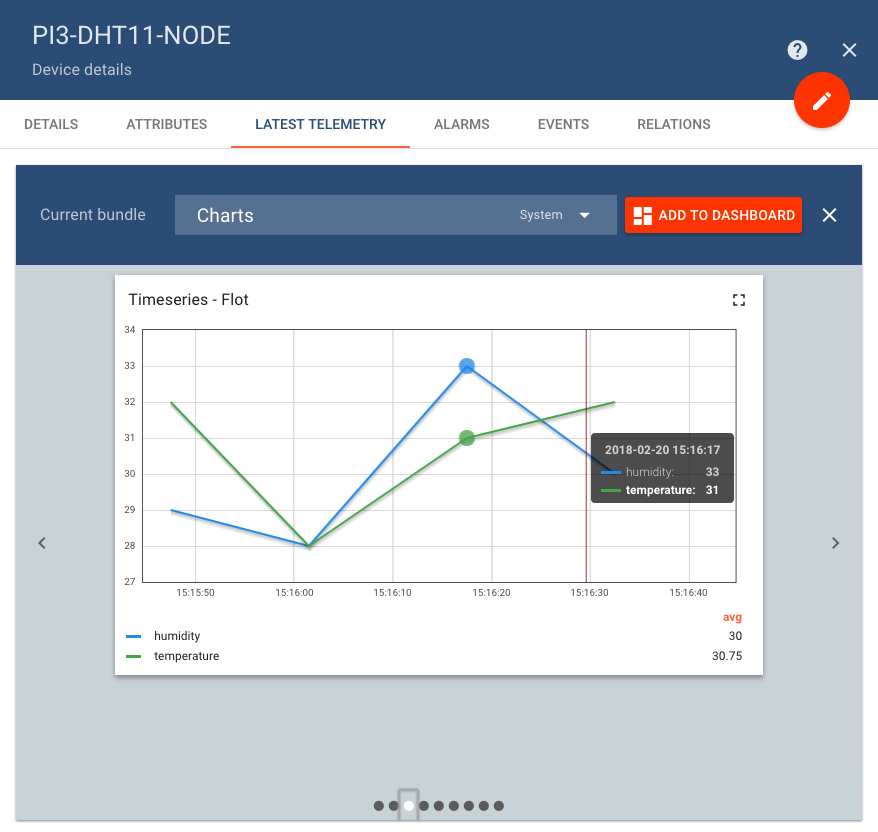
- Select the two rows and we should see a button named SHOW ON WIDGET. Click on SHOW ON WIDGET, select Charts from the drop-down, and then click on the third chart type to view time series data as shown:
- Next, click on the

