C Appendix
t-Table
Probabilities
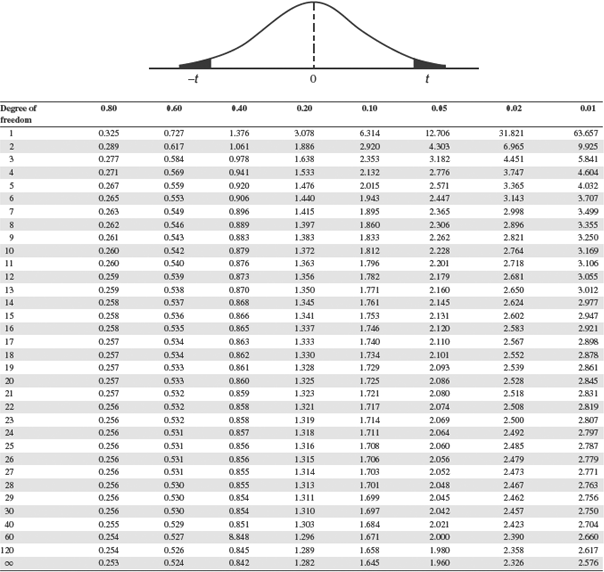
Note: The probabilities given in the table are for two-tailed tests. Thus, a probability of 0.05 allows for 0.025 in each tail. For example, for the probability of 0.05 and 21 df, t = 2.080. This means that 2.5 percent of the area under the t distribution lies to the right of t = 2.080, and 2.5 percent to the left of t = –2.080.
Source: From table III of Fisher and Yatres, Statistical Tables for Biological, Agricultural and Medical Research, 6th ed., 1974, published by Longman Group Ltd., London (previously by Oliver & Boydm Edinburgh), by permission of the authors and publishers.
Get Engineering Economy now with the O’Reilly learning platform.
O’Reilly members experience books, live events, courses curated by job role, and more from O’Reilly and nearly 200 top publishers.

