Building effective visuals
QuickSight visuals are interactive and support customization, sorting, and filters. In this section, we will see the different options and recommendations. The following are the options under QuickSight:
- Bar chart
- Line chart
- Pivot table
- Scatter plot
- Tree map
- Pie chart
- Heat map
- Autograph
Changing visual type
To change the current visual of a chart, follow the steps as follows:
- Select the analysis you wish to change.
- Next, expand the Visual types section and you will see all available options as shown in the following screenshot:
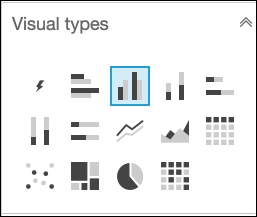
Figure 4.14: Visual types
- Now you can select the chart you want to change to.
- Alternatively, you can select ...
Get Effective Business Intelligence with QuickSight now with the O’Reilly learning platform.
O’Reilly members experience books, live events, courses curated by job role, and more from O’Reilly and nearly 200 top publishers.

