By parsing the logs, we can extract the following convergence plots for our Titanic model:
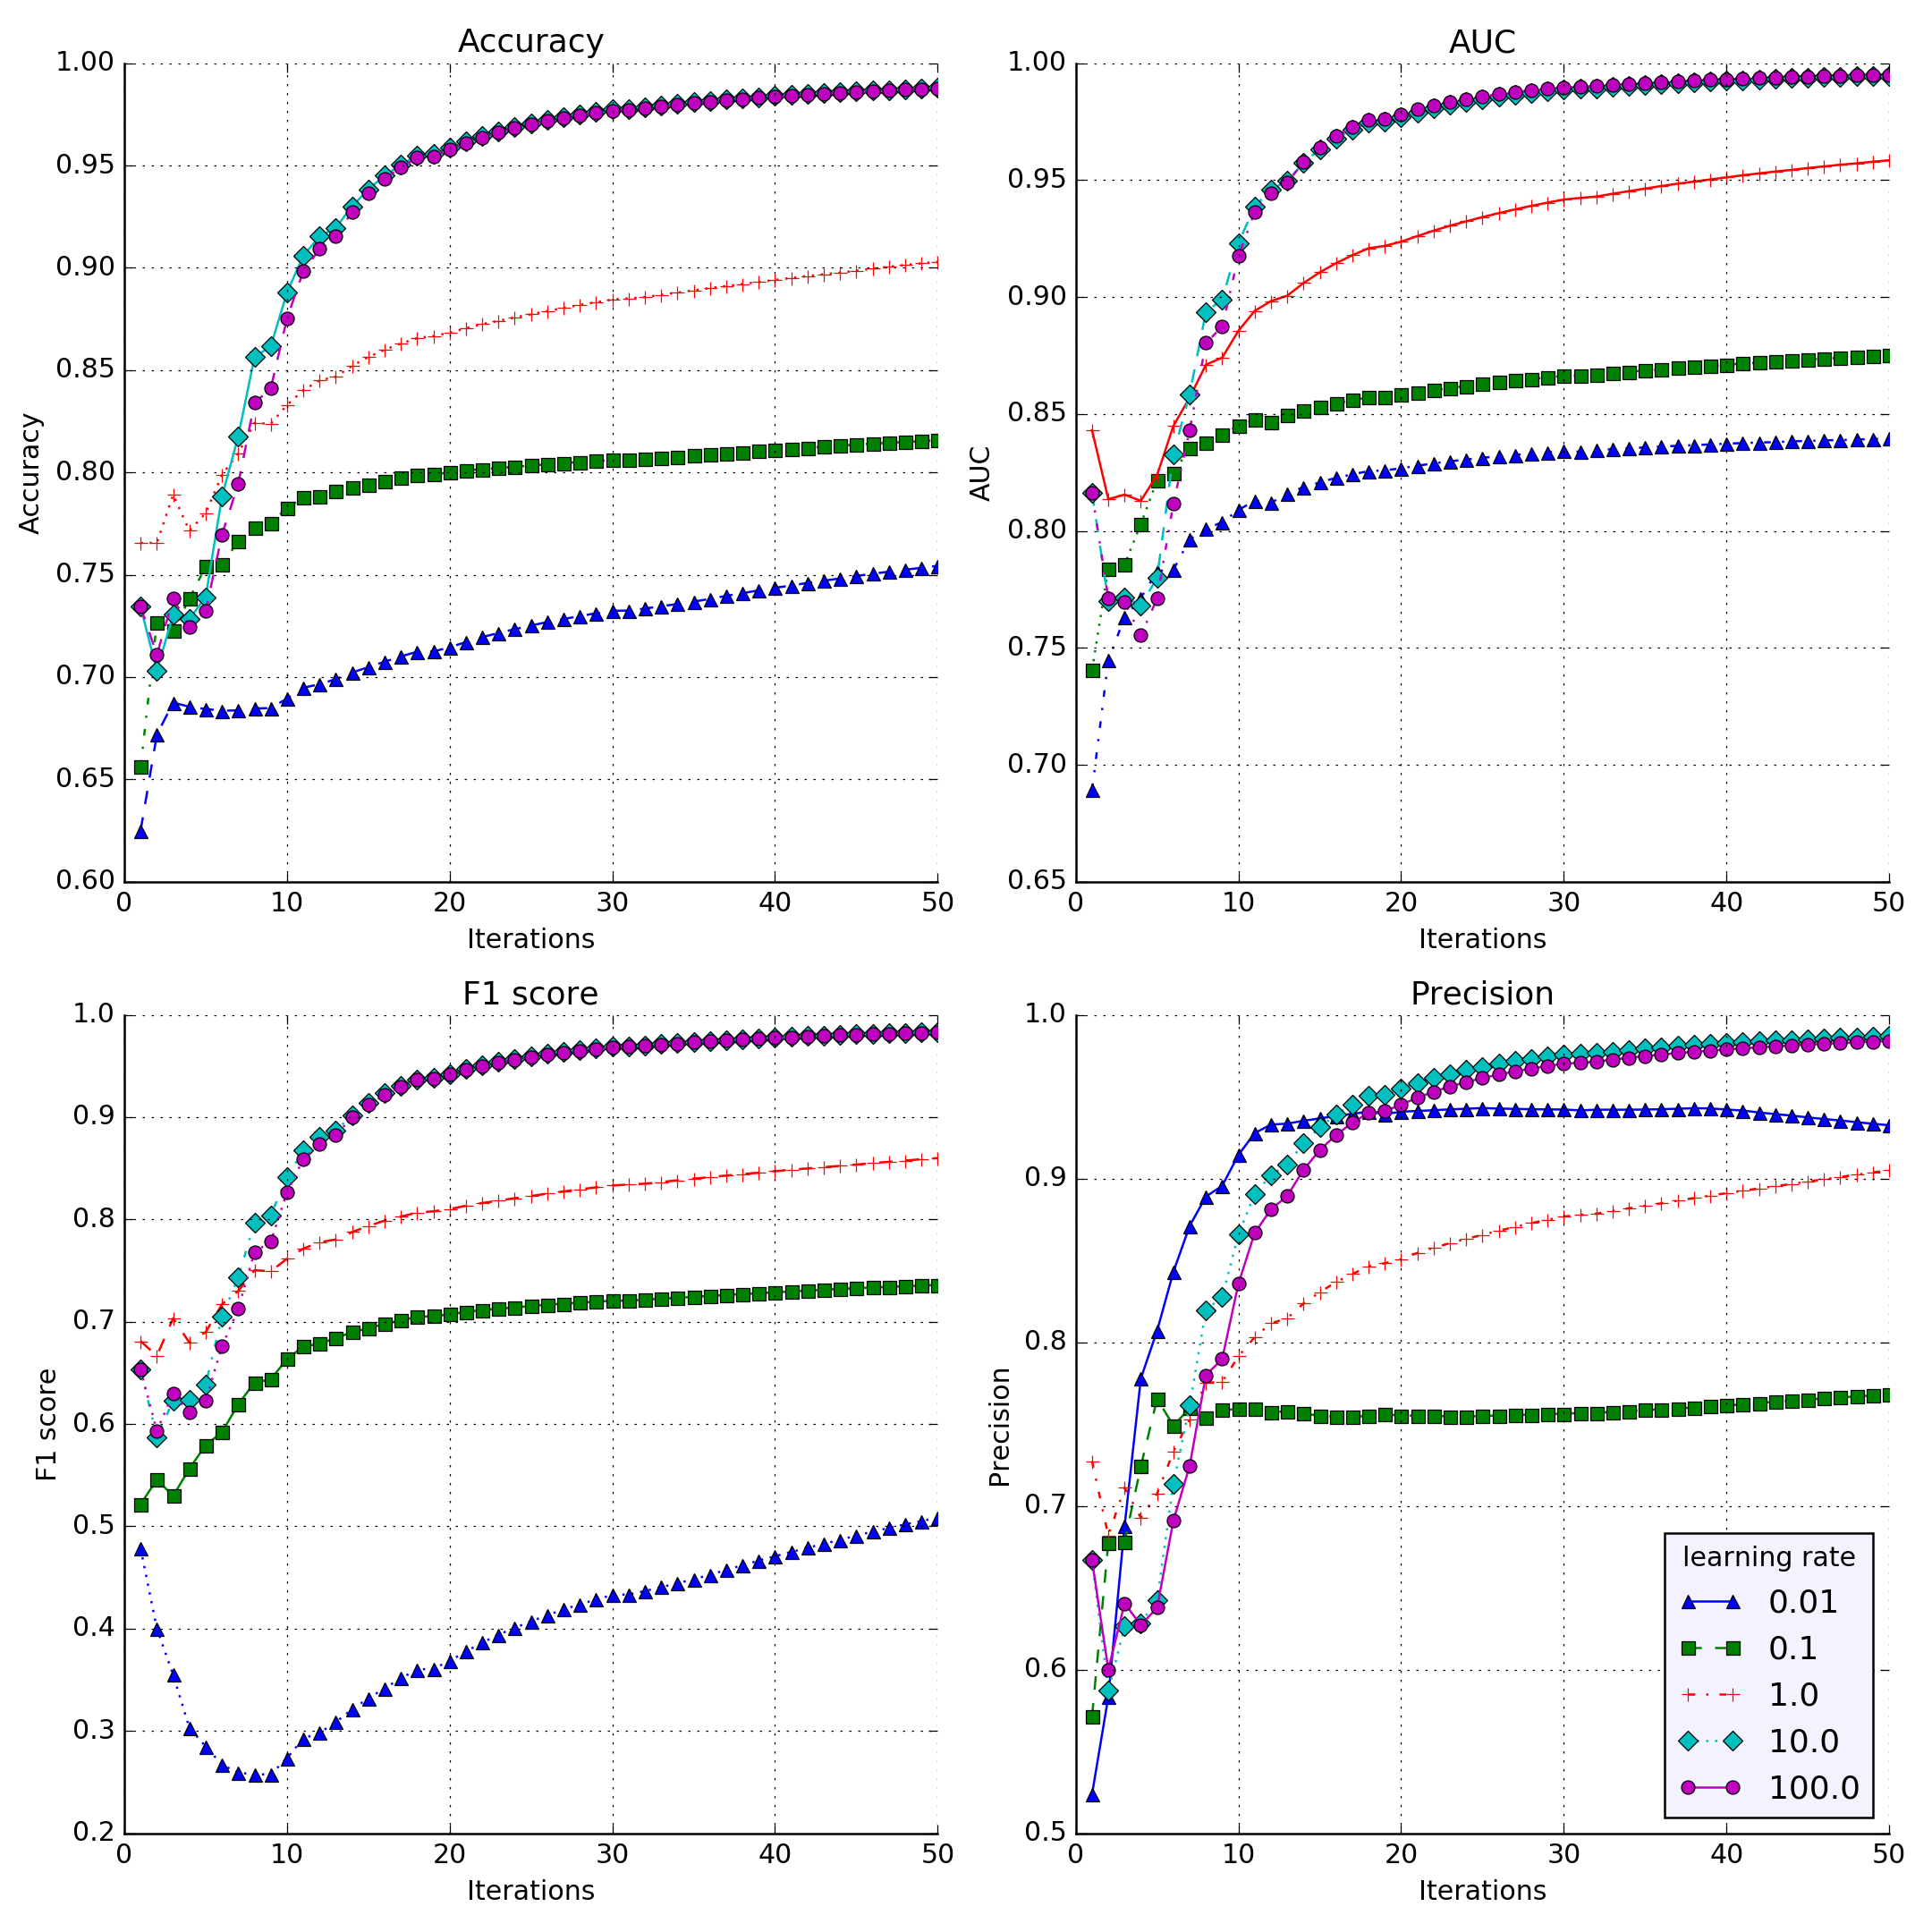
The previous screenshot of different plots shows four metrics: Accuracy, AUC, F1 score, and Precision for the five different values of the learning rate. The model was set to 50 passes with mild (10^-6) L2 regularization on the Titanic training dataset. We can see that, for all metrics, the best value for the learning rate is either 10 or 100, with a slight advantage for learning rate=100. These values converge faster and reach better scores. The smallest learning rate (0.01) converges far slower. In our context, faster convergence ...

