The Django Debug Toolbar
The Django Debug Toolbar is an indispensable tool not just for debugging but also for tracking detailed information about each request and response. Rather than appearing only during exceptions, the toolbar is always present in your rendered page.
Initially, it appears as a clickable graphic on the right-hand side of your browser window. On clicking, a toolbar appears as a dark semi-transparent sidebar with several headers:
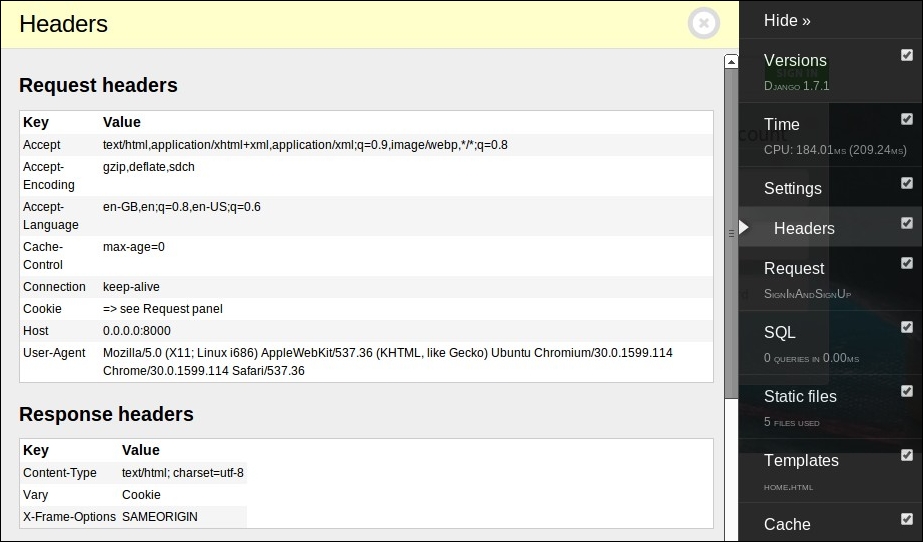
Each header is filled with detailed information about the page from the number of SQL queries executed to the templates that we use to render the page. Since the toolbar disappears when DEBUG is set to ...
Get Django: Web Development with Python now with the O’Reilly learning platform.
O’Reilly members experience books, live events, courses curated by job role, and more from O’Reilly and nearly 200 top publishers.

