Chapter 4
Visualize Your Data
Common Graphs
Visualizing your data is an important first step. The graphs described in this chapter help you discover important details about your data. For example, histograms show you the shape and range of your data, and help you find unusual data points.
This chapter presents several of the most common graphs and plots that enable you to visualize and explore data in JMP. This chapter is an introduction to some of JMPâs graphical tools and platforms. Use JMP to visualize the distribution of single variables, or the relationships among multiple variables.
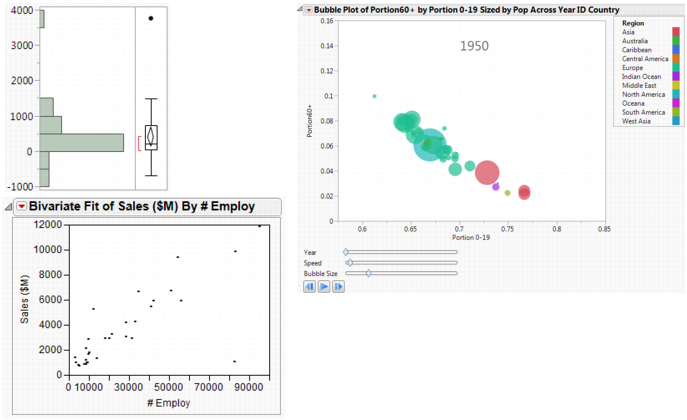
Figure 4.1 Visualizing Data with JMP
Get Discovering JMP 13 now with the O’Reilly learning platform.
O’Reilly members experience books, live events, courses curated by job role, and more from O’Reilly and nearly 200 top publishers.

