3.7. Frequential characterization of discrete-time system
3.7.1. Amplitude and phase frequential diagrams
The frequential characterization of a filter is obtained from the Fourier transform of the impulse response.
According to section 3.3.2, the frequency response of the system can be obtained by calculating the transfer function of the system H(z) then by being placed on the unity circle z, i.e., by taking ![]() as the expression of the transfer function, on condition that |z| = 1 is in the convergence domain of H(z).
as the expression of the transfer function, on condition that |z| = 1 is in the convergence domain of H(z).
Thus, we write:
![]()
From here, we can trace the amplitude response represented in the logarithmic scale by:
![]()
We can also trace the phase response ![]() from the z-transform of the impulse response
from the z-transform of the impulse response ![]() according to the normalized frequency.
according to the normalized frequency.
3.7.2. Application
Let us consider the system characterized by its impulse response, shown by:
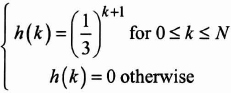
We take N equal to 1.
If the input x(k) is the impulse δ( ...
Get Digital Filters Design for Signal and Image Processing now with the O’Reilly learning platform.
O’Reilly members experience books, live events, courses curated by job role, and more from O’Reilly and nearly 200 top publishers.

