3.5. The fast Fourier transform for a time/frequency/energy representation of a non-stationary signal
Here we can use the fast Fourier transform to analyze a quasi-stationary signal. Several techniques based on the Fourier transform of the autocorrelation function of the signal help us obtain a signal characterization, especially when using the so-called periodogram and correlogram methods.
When the signal is no longer stationary, we can analyze the evolution of the frequential content of a signal from its spectrogram (see Figure 3.22).
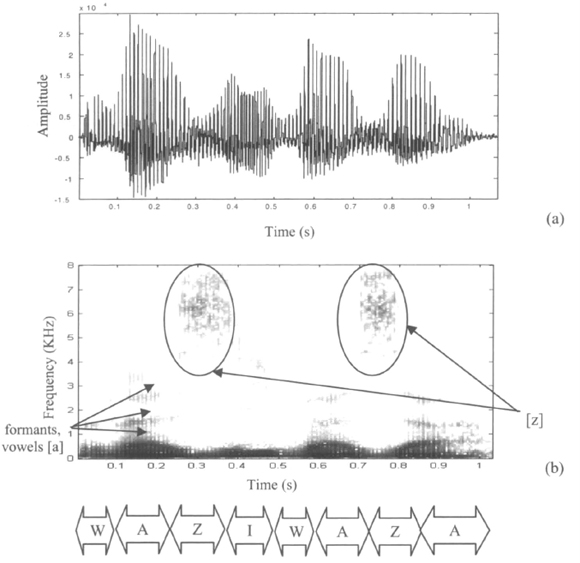
Figure 3.22. Recording of a voiced speech signal Waziwaza (a) and corresponding spectrogram (b)
This is a situation where the power spectral density is calculated by looking at the successive segments of the signal. This tool thus gives a three-dimensional representation of the voice signal: time, frequency and energy. This last quantity is represented by a degree of blackening according to the amplitude values. The higher the amplitude, the higher the blackening intensity.
In Figure 3.22, the presence of formants, which are resonance frequencies of vocal behavior, on a spectrogram corresponds to the frequency ranges whose energy is especially high and appear in the form of bands that are approximately parallel to the abscissas axis.
Get Digital Filters Design for Signal and Image Processing now with the O’Reilly learning platform.
O’Reilly members experience books, live events, courses curated by job role, and more from O’Reilly and nearly 200 top publishers.

