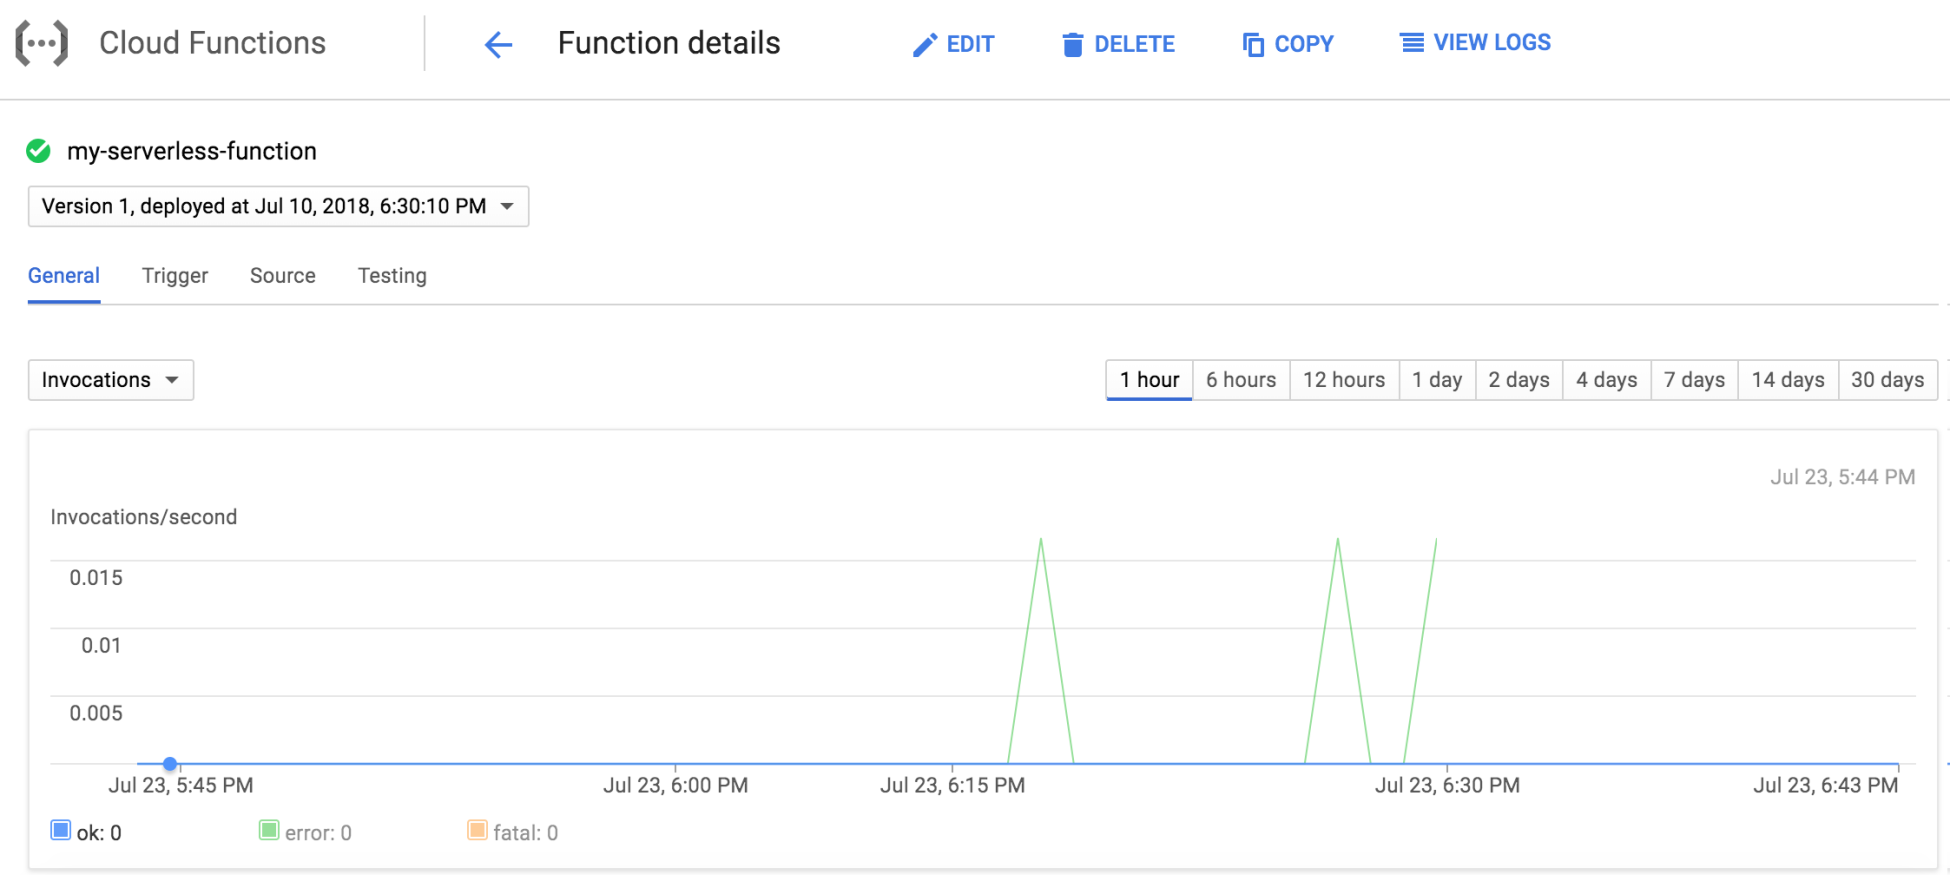
Google has provided a dashboard to view the invocation and also view the logs of the invocation through the console. So, once you log in to the console and select the specific function, we should be able to see the invocation graph and also should be able to see the execution time and also the memory used. We can view the source code and also test the function. If we click on View Logs, as per the following screenshot, we should be able to see the logs of the invocation and also be able to drill down to a detailed log:
With the dashboard, Google Cloud also has a monitoring and logging platform called stackdriver.

