Debugging and Tuning
Developer Console is the first place to look to troubleshoot unexpected behavior from a Visualforce user interface. While Developer Console is open, every interaction with Force.com is logged and can be examined in depth. In Figure 6.11, Developer Console is active and contains six entries, shown in the bottommost table.
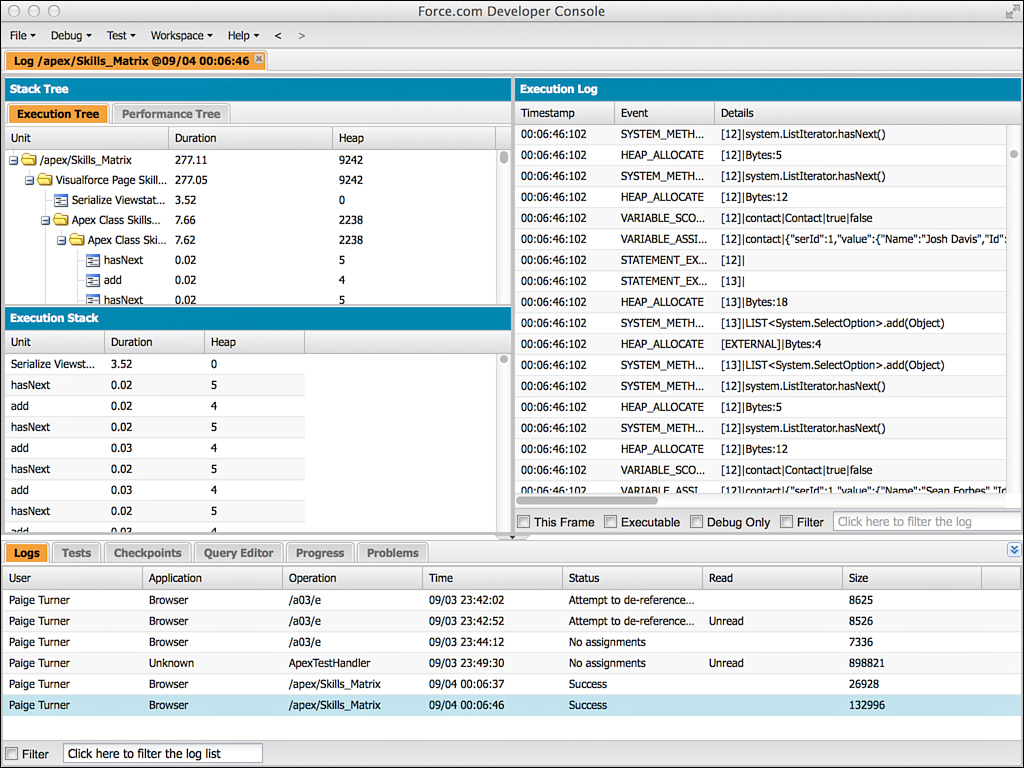
Figure 6.11 Developer Console
The last log entry has been clicked, and the other panels of Developer Console are refreshed with detailed information. This information is centered around the Apex code executed in the controller associated with the page, as well as any Apex code executed as a result of controller ...
Get Development with the Force.com Platform: Building Business Applications in the Cloud, Third Edition now with the O’Reilly learning platform.
O’Reilly members experience books, live events, courses curated by job role, and more from O’Reilly and nearly 200 top publishers.

