Since we've written log data from both the models in Chapter 2, Using Deep Learning to Solve Regression Problems, we can use TensorBoard to compare the two models graphically. Open up TensorBoard and head to the SCALARS tab. You should see something like this. You may need to click loss and val_loss to expand the graphs:
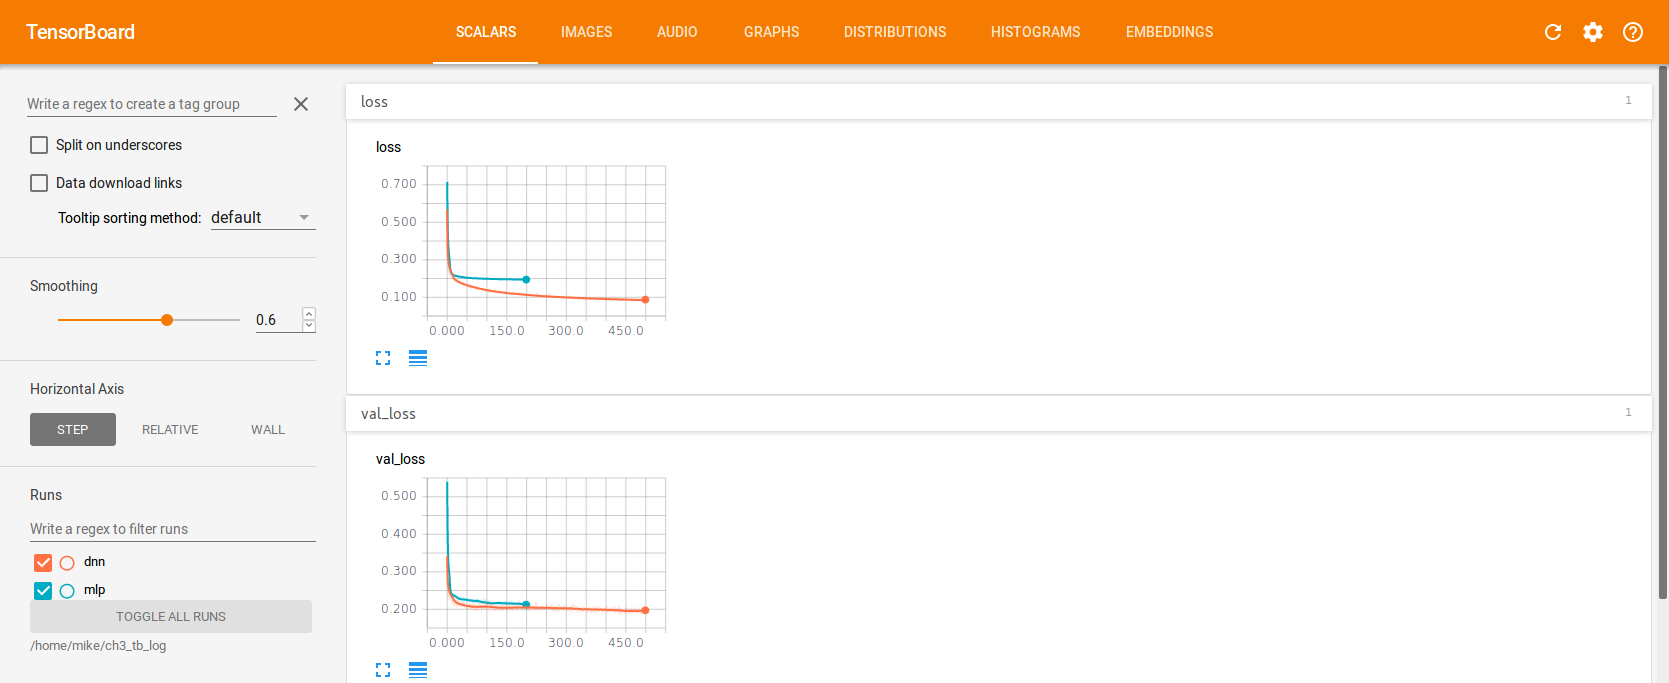
Tensorboard displaying the loss and val_loss plots for the model
If you look at the bottom-left corner of the screen, you should notice that each directory we created has a run associated with it. Both are currently selected. This means that on our graphs, we will see output for both models.
TensorBoard ...

