Transitions in charts
In this section, we will apply the knowledge of the discussed sections on animations and transitions to the charts that we designed in the previous chapters.
To create a basic enter animation for a bar chart—like the one that we can see in the following figure—we need to first create a transition for the position of each bar on the y axis and the height of each bar:
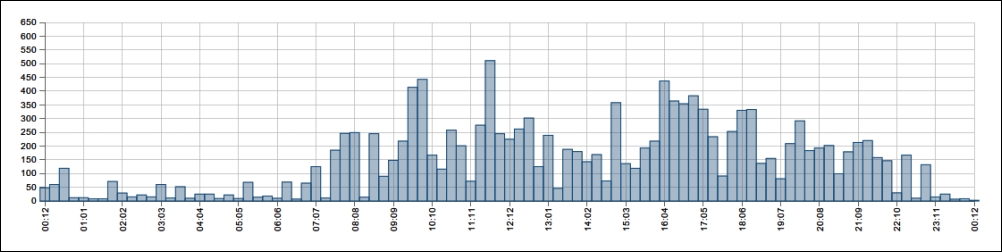
The bar chart
We want to animate from the position of the 0 value to the y value of the data point. Let's write this down as follows:
svg.select('.data') .selectAll('rect').data(data) .attr('r', 2.5) .attr('x', function(d) { return xScale(d.x) - barWidth*0.5; }) .attr('width', ...Get Data Visualization with D3 and AngularJS now with the O’Reilly learning platform.
O’Reilly members experience books, live events, courses curated by job role, and more from O’Reilly and nearly 200 top publishers.

