Working with scales
In data visualization, we will always have to deal with mapping our dataset to a specific range of pixels. Let me give you an example. We have a dataset [0, 2, 4, 6, 8, 10] that we want to display for mobile and desktop devices. On mobiles, we want to display the dataset with a total width of 480px and on desktops with a width of 1024px. In order to draw the dataset on these pixel ranges, we need to map it to these ranges. We can see this example in the following figure:
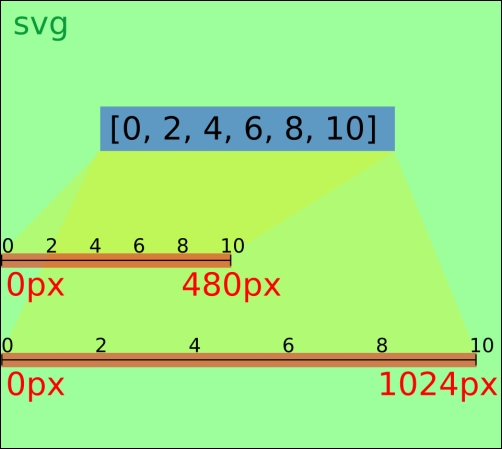
Mapping the dataset to a pixel range
D3.js provides a very useful tool to map a dataset to a certain range of pixels: d3.scale. In D3.js, we call the mapping function's ...
Get Data Visualization with D3 and AngularJS now with the O’Reilly learning platform.
O’Reilly members experience books, live events, courses curated by job role, and more from O’Reilly and nearly 200 top publishers.

