Creating a simple scatter plot
In this chapter, we have so far gathered a lot of knowledge that we want to apply to a real-world application. Let me briefly summarize what you learned so far: creating a Selection of circles, binding an array of data to the Selection, creating new circles if there are new values in the array, and changing their attributes depending on the bound data. These are all the necessary prerequisites to create a first scatter chart. In the following figure, we can already see what we want to create:
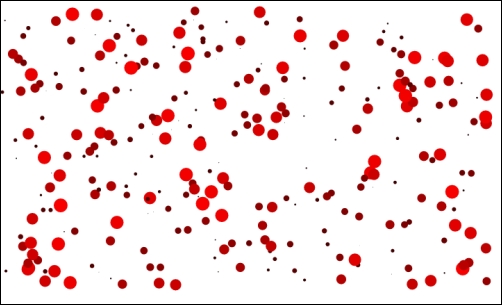
Simple scatter chart
To go one step further, we want to add and delete data points to the chart to use and see the power of data ...
Get Data Visualization with D3 and AngularJS now with the O’Reilly learning platform.
O’Reilly members experience books, live events, courses curated by job role, and more from O’Reilly and nearly 200 top publishers.

